IOC trade ideas

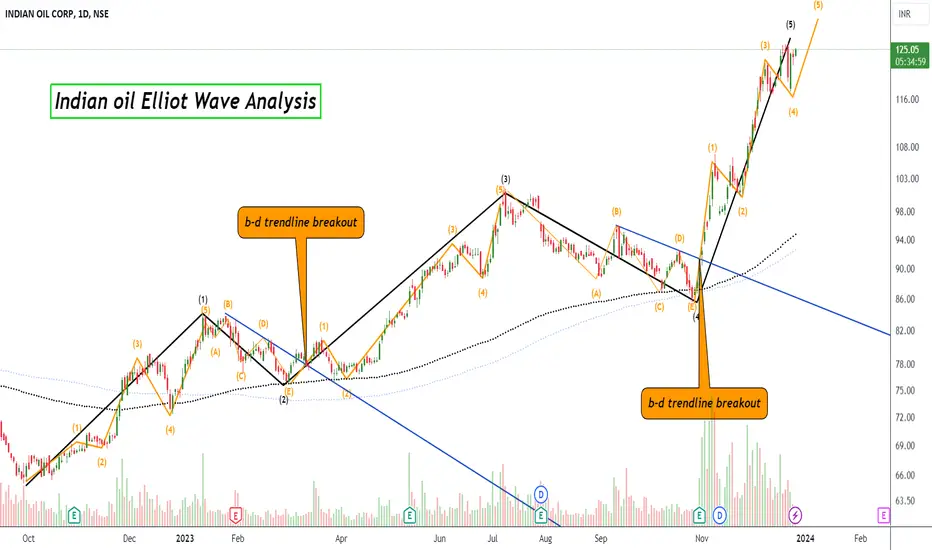
Indian Oil share Elliot Wave AnalysisIndian OIl share daily time frame analysis
this stock upside impulse wave 1,2,3,4 or 5
Wave 1,3or 5 Impulse and clear count sub wave
Wave 2 or 4 Corrective Wave and clear count sub A,B,C,D OR E triangle correction
#IOCif holding @105 no need to exit also if want fresh buy can consider with sl @103 today all omc moving higher so expecting some news.

Ioc breaking trend line Ioc is breaking trend line of daily and weekly time frame may be continue rally this week

[Positional] IOC Sell IdeaNote -
One of the best forms of Price Action is to not try to predict at all. Instead of that, ACT on the price. So, this chart tells at "where" to act in "what direction. Unless it triggers, like, let's say the candle doesn't break the level which says "Buy if it breaks", You should not buy at all.
=======
I use shorthands for my trades.
"Positional" - means You can carry these positions and I do not see sharp volatility ahead. (I tally upcoming events and many small kinds of stuff to my own tiny capacity.)
"Intraday" -means You must close this position at any cost by the end of the day.
"Theta" , "Bounce" , "3BB" or "Entropy" - My own systems.
=======
I won't personally follow any rules. If I "think" (It is never gut feel. It is always some reason.) the trade is wrong, I may take reverse trade. I may carry forward an intraday position. What is meant here - You shouldn't follow me because I may miss updating. You should follow the system I share.
=======
Like -
Always follow a stop loss.
In the case of Intraday trades, it is mostly the "Day's High".
In the case of Positional trades, it is mostly the previous swings.
I do not use Stop Loss most of the time. But I manage my risk with options as I do most of the trades using derivatives.
=======

IOC : Booking ProfitsClosed the position @104.05 on 07/11/2023.
Booked a profit of about 17.31% of the capital involved. This was a clean trade that moved perfectly according to the plan.
Price may make a further rally upwards for about 8%. But there are chances for that move to be pretty corrective and the downside risk is also high. So as of now booking profit is the most intelligent decision as per my trade plan.
Moreover I do have holding in other oil companies and hence if the sector moves as a whole I can still be part of it. So I'm booking profit in this position to take some chips off the table.
Will consider a re-entry if it falls back to the low of the parallel channel.
Further details, if any, will be updated underneath this post.

GOOD TRADING SETUP DEVELOPING IN IOCThe stock has been making clean impulse moves from oct 2022 and seems to have completed the wave 4 structure. The 5th wave for the stock should be beginning shortly which can drive the stock up nearly 12-17%.
With one of its peers(BPCL) already announcing a mega result (both Q-o-Q and Y-o-Y), something similar could be expected from this stock as well which could trigger the rally( 31 oct expected result date).
84.5 can be used stop loss and 105-107 should be the target which provides a pretty good risk reward from CMP.
*note- One should do thorough analysis and research before taking up any entry.

Iocl interpretation Pleasure to have you here. This is an investment analysis done for the Tickr, and potential in the Technicals.
In this Daily Chart , the chart has been slightly in uptrend and as soon as it crosses its resistance, we will decide to make a position in the stock,
if you like the idea please like the post :) It will be a motivation to further such ideas.
Disclaimer Note:-
1) This is just an analysis setup and no advice to trade/trade
2) If you are making position, please have your risk to reward analysis and then enter.
3) The analysis and target shared does not mean i trade in them, entry and exit depends on the market open and other factors.

[Positional] IOC Channel BetNote -
One of the best forms of Price Action is to not try to predict at all. Instead of that, ACT on the price. So, this chart tells at "where" to act in "what direction. Unless it triggers, like, let's say the candle doesn't break the level which says "Buy if it breaks", You should not buy at all.
=======
I use shorthands for my trades.
"Positional" - means You can carry these positions and I do not see sharp volatility ahead. (I tally upcoming events and many small kinds of stuff to my own tiny capacity.)
"Intraday" -means You must close this position at any cost by the end of the day.
"Theta" , "Bounce" , "3BB" or "Entropy" - My own systems.
=======
I won't personally follow any rules. If I "think" (It is never gut feel. It is always some reason.) the trade is wrong, I may take reverse trade. I may carry forward an intraday position. What is meant here - You shouldn't follow me because I may miss updating. You should follow the system I share.
=======
Like -
Always follow a stop loss.
In the case of Intraday trades, it is mostly the "Day's High".
In the case of Positional trades, it is mostly the previous swings.
I do not use Stop Loss most of the time. But I manage my risk with options as I do most of the trades using derivatives.
=======

IOC (Swing):IOC (Swing):
A 75-100% up move is on the cards for swing.
Keep adding in chunks while script ranges around 75-85.
Appropriate resistances are highlighted.
As this is weekly chart, target can be attained over 6 months.
Note: Do your own due diligence before taking any action.
I would be posting updates for this chart in the comments sections as time progresses.
Queries are welcome.

IOC is a long term investment idea and a portfolio stockIndian Oil Corporation Ltd. is a diversified, integrated energy major with presence in almost all the streams of oil, gas, petrochemicals and alternative energy sources. The company owns over 36,445 Fuel Stations across India. Indian Oil Corporation CMP is 92.60.
The Negative aspects of the company are declining annual net profit, declining cash from operations annual and MFs are decreasing stake. The Positive aspects of the company are low debt, zero promoter pledge and FIIs are increasing stake.
Entry after closing above 93.50. Targets in the stock will be 95.10 and 96.35. Long term targets in the stock will be 98.25 and 100. Stop loss in the stock should be maintained at closing below 88.70.
The above information is provided for educational purpose, analysis and paper trading only. Please don't treat this as a buy or sell recommendation for the stock. We will not be responsible for any Profit or loss that may occur due to any financial decision taken based on any data provided in this message.

Indian Oil: % years Inverse Head and Shoulder BreakoutIOC has been in an Inverted H&S pattern formation since March 2018 which it completed in July 2023. Inverted H&S patterns often implicate a bullish run post pattern breakout and they become crucial specially when the pattern is in formation phase for dew years.
IOC replicates a similar view and the stock has given a breakout in May 2023.
The run still continues supported with high crude oil prices as well. With a long term view the stock seems to go upto 129 levels in few months from now. (Given the pattern is observed in monthly chart)

Indian Oil Weekly BreakoutPrice consolidated for nearly 2 years .
Finally gave breakout and retested the same area.
Price target :- 20 to 30% minimum.

IOC for a SpikeGood Reversal is possible in IOC, as it is recovering slowly and seems to be heading towards 98-odd levels in a week or 2.

inside bar candle formation inside bar candle trade pattern
above 101 buy
below 98.60 closing sell
below this level sell


IOC looks goodOne can look at IOC for long at CMP Rs. 93.25 Good price action and volume is seen.
Kindly consult your equity advisor or do your own research before buying. Sharing above only for educational purpose.


Inverted Head & Shoulder pattern in #IOCHello Viewers,
In #IOC inverted head and shoulder pattern forming.
1st target can be :- 113
2nd target can be :- 142
#longterm NSE:IOC
#ioc
Educational purpose only

IOC - Indian Oil Corporation Based on Monthly chart pattern, we can expect initially a tgt between 106 - 113 and the next zone of 146 - 150.
So accumulate slowly from cmp 92 & down till 70.
Patience is important.
Note: This view shared is for learning purpose. Do your analysis from your side too.


IOC could burst into an upward move.IOC has formed a bullish structure on the weekly chart. A crucial aspect is a weekly RSI close above 60. It is also about to break out from a down trending line. A long position could be considered keeping the following levels in mind:
LONG ABOVE: 81.55
STOP LOSS: 77.95
TARGET 1: 85.15
TARGET 2: 88.75
Please do wait for at least a 15 min candle close above the "LONG ABOVE " level before initiating the trade.
_______________________________________________________________________________________________________________________________

