IPCA Laboratories – Weekly Technical Analysis 📈 IPCA Laboratories – Weekly Technical Analysis (For Study Purpose Only)
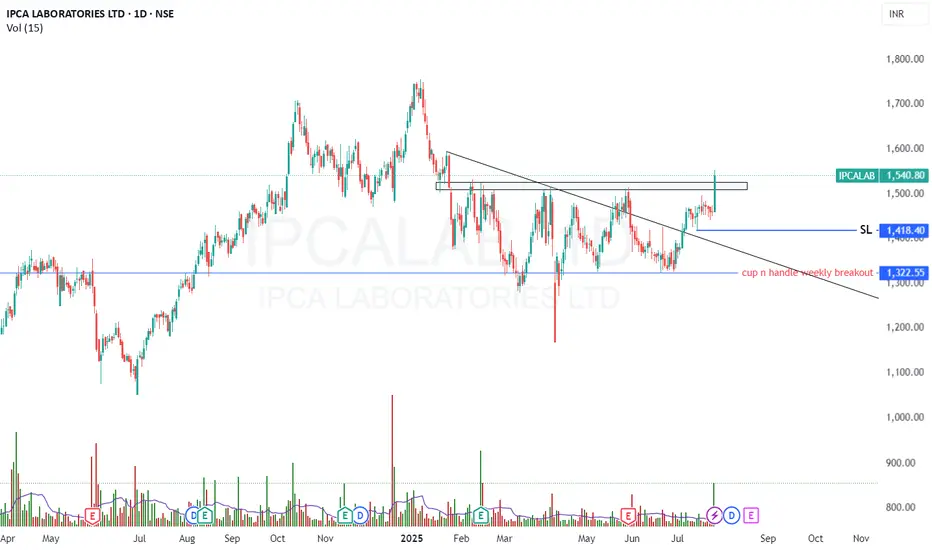
Ipca Labs has successfully completed a Cup and Handle breakout on the weekly chart, indicating a strong bullish setup after a prolonged consolidation phase.
After forming a double top and undergoing a nearly 6-month consolidation, the stock recently broke out above the neckline and range of ₹1320–₹1510, followed by a textbook retest of the breakout zone, which further strengthens the breakout's validity.
🔍 Key Technical Highlights:
✅ Pattern Formed: Weekly Cup and Handle retest and 6 month range breakout
📉 Previous Structure: Double top ➜ breakdown ➜ 6-month range consolidation
🔼 Breakout & Retest Zone: ₹1320–₹1510
✅ Retest Completed: Confirmed on weekly chart with supportive volume and price stability
🎯 Upside Targets:
Short-term: ₹1600
Medium-term: ₹1700
Long-term: New All-Time High (above ₹1750+)
🛑 Risk Management:
Stop-Loss: ₹1480 or (below retest zone)
📊 Supporting Indicators:
RSI trending upward, currently above 60 (bullish zone)
MACD crossover confirms positive momentum
Volume confirms strength during breakout
📌 Disclaimer: This analysis is for educational and study purposes only. Not a buy/sell recommendation.
IPCALAB trade ideas
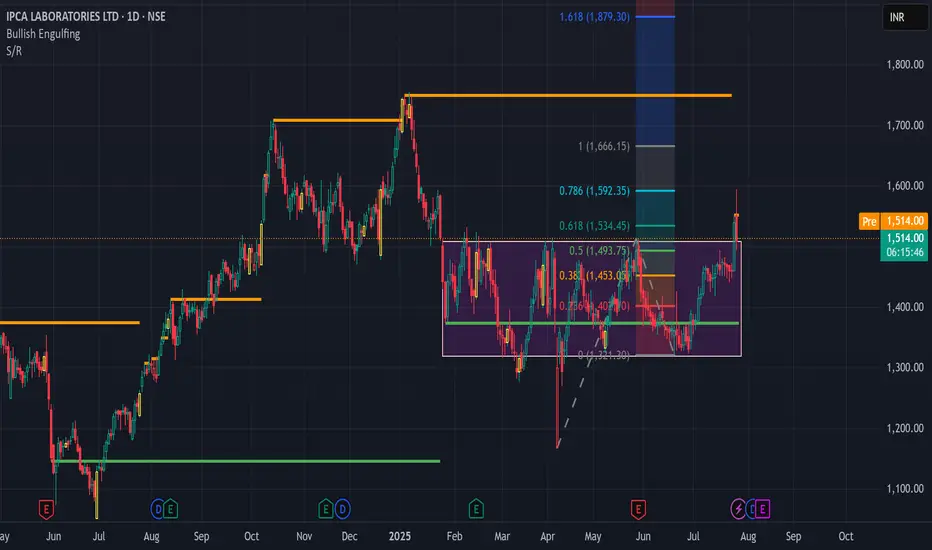
pcalabs BreakoutNSE:IPCALAB is making a Multi-month High. You can buy once it crosses 1552 and 1st Target would 1666. You can keep Second Target as 1800, provided try to achieve the same using Trailing Stoploss.
IPCA🔷 IPCA Trade Setup Summary
Key Element Details
Trade Type BUY (Long)
Entry Price ₹1323
Stop Loss ₹1280
Target Price ₹2458
Risk ₹43
Reward ₹1135
Risk-Reward 26.4 : 1 ✅
Last High ₹1755
Last Low ₹1052
📌 Entry at ₹1323 is inside the Weekly SOE zone, supported by HTF structure below.
🔷 Setup Strengths
✅ All trends are UP across HTF, MTF, ITF
✅ Entry zone = Weekly SOE, aligning with recent price action
✅ SL ₹1280 is just below SOE – technically valid and protected
✅ Target ₹2458 is long-term but justified post-breakout of ₹1755
🔷 Trade Plan Summary
Action Level (₹) Reason
Entry 1323 Inside Weekly SOE & near HTF avg
SL 1280 Just below SOE, protected by daily zone
🔷 Multi-Timeframe Demand Zone Overview
Timeframe Zone Type & Logic Zone Range (₹) Avg Price Notes
Yearly BUFL 1161 – 1052 1107 Major structural base
Half-Yearly BUFL + Breakout Base 1374 – 1052 1213 Massive higher timeframe demand
Quarterly BUFL 1374 – 1052 1213 Matches half-year zone
Monthly DMIP 1213 – 1052 1133 Same area as HTF zones
Weekly SOE 1323 – 1280 1302 Entry sits right here
Daily DMIP + SOE 1200 – 1181 1191 Near SL for secondary entry/watch zone
Intraday DMIP 1362 – 1155 1259 Covers both SL and entry
Target 2458 Based on long-term breakout projection
🔷 Quick Verdict
📈 RR of 26.4:1 is outstanding – small risk for very high potential.
🔄 Zone alignment is excellent from Yearly to 60M.
🎯 Target requires breakout above ₹1755, then blue sky zone begins.
⏳ Ideal for swing to positional holding.

IPCALABNSE:IPCALAB
Note :
1. One should go long with a Stop Loss, below the Trendline or the Previous Swing Low.
2. Risk :Reward ratio should be minimum 1:2.
3. Plan your trade as per the Money Mangement and Risk Appetite.
Disclamier : You are responsible for your profits and loss.
The idea shared here is purely for Educational purpose.
Follow back, for more ideas and their notifications on your email.
Support and Like incase the idea works for you.

Ipca labsIpca labs looks to be in 3 of 3rd wave.
Rsi in overbought zone, taking support at 60 confirms continuation of uptrend.

Review and plan for 30th December 2024Nifty future and banknifty future analysis and intraday plan.
Swing trade.
This video is for information/education purpose only. you are 100% responsible for any actions you take by reading/viewing this post.
please consult your financial advisor before taking any action.
----Vinaykumar hiremath, CMT

IPCALAB: Not confirmation but predictingThere is decent chance a support level has been created. Looks like it will hold.
Therefore why not? Looking for long.
Here I am trying to predict entry even before any visible confirmation. Might be too soon or it may go wrong. Does not hurt to try but with HARD SL.

infyinfosys stocks has good results,fiis also increase investment in sep quarter ,if check technically stocks forming reverse head and shoulder pattern ,show that this is bullish sign for targgt of 2029 soon

suzlon energy suzlon energy makes famous cup and handle pattern on weekly chart with emerging weekly volume ,so its good opportunity for buying here with target of 113 short to long term

IPCA LAB S/R Support and Resistance Levels:
Support Levels: These are price points (green line/shade) where a downward trend may be halted due to a concentration of buying interest. Imagine them as a safety net where buyers step in, preventing further decline.
Resistance Levels: Conversely, resistance levels (red line/shade) are where upward trends might stall due to increased selling interest. They act like a ceiling where sellers come in to push prices down.
Breakouts:
Bullish Breakout: When the price moves above resistance, it often indicates strong buying interest and the potential for a continued uptrend. Traders may view this as a signal to buy or hold.
Bearish Breakout: When the price falls below support, it can signal strong selling interest and the potential for a continued downtrend. Traders might see this as a cue to sell or avoid buying.
20 EMA (Exponential Moving Average):
Above 20 EMA: If the stock price is above the 20 EMA, it suggests a potential uptrend or bullish momentum.
Below 20 EMA: If the stock price is below the 20 EMA, it indicates a potential downtrend or bearish momentum.
Trendline: A trendline is a straight line drawn on a chart to represent the general direction of a data point set.
Uptrend Line: Drawn by connecting the lows in an upward trend. Indicates that the price is moving higher over time. Acts as a support level, where prices tend to bounce upward.
Downtrend Line: Drawn by connecting the highs in a downward trend. Indicates that the price is moving lower over time. It acts as a resistance level, where prices tend to drop.
RSI: RSI readings greater than the 70 level are overbought territory, and RSI readings lower than the 30 level are considered oversold territory.
Combining RSI with Support and Resistance:
Support Level: This is a price level where a stock tends to find buying interest, preventing it from falling further. If RSI is showing an oversold condition (below 30) and the price is near or at a strong support level, it could be a good buy signal.
Resistance Level: This is a price level where a stock tends to find selling interest, preventing it from rising further. If RSI is showing an overbought condition (above 70) and the price is near or at a strong resistance level, it could be a signal to sell or short the asset.
Disclaimer:
I am not a SEBI registered. The information provided here is for learning purposes only and should not be interpreted as financial advice. Consider the broader market context and consult with a qualified financial advisor before making investment decisions.
IPCALAB Cup with handle pattern breakoutIPCA LABS a leading pharma company with good fundamentals have been moving to make a cup-with-handle pattern. As shown in the idea the pattern has given a breakout and might move to the target of the pattern. Good stock to learn about cup-with-handle pattern.

Cup and Handle BreakoutThe stock has made a 3 year Cup and handle Breakout. Can buy between a range of 1360-1375 for a 2x Target for long term.

Momentum Trading Picks:Pharma Stock Ipca LabThe chart presented here is a daily chart, detailing precise entry and stop-loss levels. However, upon examining the weekly chart, a breakout of the cup pattern becomes evident. The target for this pattern is determined by the depth of the cup, making it a compelling long-side investment. The projected target is approximately 700 points higher, suggesting that the price could reach the 2000 rupee level.

IPCA Labs: Cup and Handle Pattern Awaiting Breakout
Chart Pattern: Cup and Handle
Potential Breakout: Awaiting confirmation of breakout soon
Technical Indicator: MACD showing a bullish crossover
Resistance Level: Stock is breaking a strong resistance level

Can IPCA Break the trend?Ipca Laboratories Ltd. engages in the manufacturing, marketing, research, and development of pharmaceutical products. Its products include Hydroxychloroquine Sulphate, Artemether and Lumefantrine and Acceclofenac and its combinations. The Company has 18 manufacturing units in India manufacturing API's and formulations for the world market.
Ipca Laboratories Ltd CMP 1220.75. The positive aspects of the company are Mutual Funds Increased Shareholding in Past Month, Company with Low Debt, Company with Zero Promoter Pledge and FII / FPI or Institutions increasing their shareholding. The Negative aspects of the company are High PE (PE=56.6), MFs decreased their shareholding last quarter, Declining Net Cash Flow : Companies not able to generate net cash and De-growth in Revenue, Profits and Operating Profit Margin in recent results.
Entry can be taken after closing above 1225. Targets in the stock will be 1252 and 1294. The long-term target in the stock will be 1328 and 1357. Stop loss in the stock should be maintained at Closing below 1136.
The above information is provided for educational purpose, analysis and paper trading only. Please don't treat this as a buy or sell recommendation for the stock. We do not guarantee any success in highly volatile market or otherwise. Stock market investment is subject to market risks which include global and regional risks. We will not be responsible for any Profit or loss that may occur due to any financial decision taken based on any data provided in this message.

buy at zone - swing / intraday
this zone marked is potential reversal zone . expecting reversal from those zones . buyers can look for buying confirmation inside the zone.
-- intraday traders can keep 0.236 fib level of swing C to latest swing low. entry is strictly inside zone. keep sl below zone
-- swing traders can keep 0.5 fib level as tgt.
-- it may either reverse from zone1 or zone2 or both zones may fail ..


Keep An Eye - IPCALAB📊 Script: IPCALAB
📊 Sector: Pharmaceuticals
📊 Industry: Pharmaceuticals - Indian - Bulk Drugs
Key highlights: 💡⚡
📈 Keep An Eye on Script, it is trading near its resistance level which is 1248 and may give breakout of it.
📈 Script is trading at upper band of BB.
📈 MACD is giving crossover.
📈 Double Moving Averages are also giving crossover.
📈 Right now RSI is around 62.
📈 One can go for Swing Trade only above 1248 level.
BUY ONLY ABOVE 1248
⏱️ C.M.P 📑💰- 1237
🟢 Target 🎯🏆 - 1317
⚠️ Stoploss ☠️🚫 - 1198
⚠️ Important: Always maintain your Risk & Reward Ratio.
✅Like and follow to never miss a new idea!✅
Disclaimer: I am not SEBI Registered Advisor. My posts are purely for training and educational purposes.
Eat🍜 Sleep😴 TradingView📈 Repeat 🔁
Happy learning with trading. Cheers!🥂

IPCA lab31/03/2024
IPCA lab on monthly chart
BO above 1385
SL : As per your risk
Target : 10 to 20 % above BO
Information is only for study purpose

Ipcalab , a pharmaceutical company Ipcalab , a pharmaceutical company, is currently positioned at its Fibonacci reversal levels, indicating a potential turning point in its price action. Following bullish signals, the stock is expected to trade within the range of 1320 to 1350. This suggests a positive sentiment among investors, with the possibility of upward momentum in the near term. Traders may monitor further price action for confirmation of this bullish trend.

#IPCALAB Stock looks good for another 20-25% move above. #IPCALAB
Stock looks good for another 20-25% move above.
A candle close below ₹1100 would trigger me to close the position.
1) There is a bullish pennant forming with measured target of above ₹1400
2) Horizontal previous ATH support - Looks great.

Bullish Flag in IPCA lab- Action continuesAbout IPCA laboratories
Ipca Laboratories Limited is an Indian multinational pharmaceutical company based in Mumbai, India. It was founded in 1949 by a group of businessmen and medical professionals. The company manufactures and markets a wide range of pharmaceutical products, including active pharmaceutical ingredients (APIs), formulations, and bulk drugs.
Ipca is one of India's leading API exporters. It produces over 80 APIs, which are sold to customers in over 100 countries. The company's API portfolio includes a wide range of therapeutic segments, such as antibiotics, antifungals, antivirals, cardiovasculars, and central nervous system drugs.
Ipca also manufactures and markets a wide range of formulations, including tablets, capsules, injectables, and ointments. The company's formulation portfolio covers a wide range of therapeutic segments, such as anti-infectives, pain management, cardiovasculars, and diabetes.
Ipca has a strong manufacturing base, with six plants located in India and one plant in Mauritius. The company's plants are all USFDA and GMP compliant.
Ipca is a listed company on the Bombay Stock Exchange and the National Stock Exchange of India. The company's market capitalization is over ₹10,000 crores.
Ipca is a leading player in the Indian pharmaceutical industry. It is known for its high-quality products and its strong focus on research and development. The company is committed to providing affordable and accessible healthcare to people around the world.
About Flag Patterns
Imagine a group of soldiers charging up a hill, their flags flying high. They are unstoppable, and their momentum is carrying them forward. But then, they reach a plateau, and the enemy opens fire. The soldiers are forced to take cover, and the battle stalls.
This is similar to what happens in a flag breakout pattern. The stock price makes a sharp move in one direction, creating the flagpole. Then, the price consolidates for a period of time, forming the flag. This consolidation period represents a pause in the battle, as bulls and bears fight for control.
But eventually, one side will gain the upper hand. If the bulls are able to break the stock price above the flag, it signals that the uptrend is likely to continue. This is known as a flag breakout.
Flag breakouts can be very powerful, as they represent a continuation of a strong trend. The price often moves quickly and decisively after a breakout, and traders can take advantage of this by entering long positions.
Here is a beautiful analogy for a flag breakout:
Imagine a bird soaring through the sky. It is flying with the wind in its wings, and it seems effortless. But then, the bird encounters a flock of geese. The geese are flying in the opposite direction, and they create a strong updraft.
The bird is forced to slow down, but it doesn't give up. It flaps its wings harder and harder, and eventually it is able to break through the updraft and continue on its journey.
A flag breakout is similar to the bird breaking through the updraft. It represents a continuation of a strong trend, even in the face of resistance.
Flag breakouts can be a great opportunity for traders to profit. However, it is important to note that no trading pattern is guaranteed. It is always important to use risk management and to trade with a plan.
IPCA HAS FORMED A FLAG BREAKOUT AND NEXT TARGETS CAN BE
1) 1019 by 29th sep'23 ( 8.7% upside)
2) 1124 by 30th oct'23 ( 18.7% upside)
WAIT FOR A 15 min candle to close above 943 for a perfect entry.
STOP LOSS 880 day close basis.

💥IPCA Labs💥-Nice Breakout💥IPCA Labs💥-Nice Breakout
Capital to be deployed- 20k
Investing Price -1020-1040
Breakout Price-1006
Stoploss-934
Targets-1144-1353-1678
RT for max reach
#ipca #StocksToBuy #stocks #StocksToTrade #StocksInFocus #stockstowatch #StocksInNews
