IRB INFRA: Cup & Consolidation Breakout🔍 Chart Analysis
The stock formed a textbook cup pattern, indicating accumulation after a long downtrend and also given 200 EMA breakout.
After forming the rounded base, it entered a tight consolidation range (highlighted in blue).
Today, the stock broke out of this range with strong bullish momentum and rising volume.
Immediate support lies at ₹49.25, the base of the consolidation box.
Next major hurdle: Strong resistance at ₹60.52, which aligns with a previous swing top.
📈 Why This Setup Looks Promising
Cup and handle patterns often precede major upward moves, especially when breakouts happen with volume.
Breakout from consolidation confirms bullish interest near ₹53 zone.
The stock has already corrected about 47% from its all-time high, offering a potential value opportunity if trend reversal sustains.
🎯 Levels to Watch
Support: ₹49.25
Resistance: ₹60.52
Breakout Confirmation Zone: ₹53.00–₹54.00
⚠️ Disclaimer
This is not investment advice. Please do your own research or consult your financial advisor before taking any position. The market is subject to risk and uncertainty.
IRB trade ideas

IRB Infra - A Bullish Setup on M/W/D TFIRB Infra showing Bullishness.
On All Higher TF the stock is Bullish.
We can expect a TGT of 80 in Medium Term
IRB Infra Long IRB Infra Looks +ve above 60. This is following Descending Slanting Triangle pattern and looks like retest is almost done. But better be safe so preferrable after 60!! Then there is a potential to go 17% minimum!!

IRB Infra TargetBased on RSI Hidden Divergence. While the price is going up, RSI is going down.. This indicates trend continuation..

IRB INFRA DEV LTD - ENTRY INITIATED FOR UP RALLYEverything is pretty much explained in the picture itself.
I am Abhishek Srivastava | SEBI-Certified Research and Equity Derivative Analyst from Delhi with 4+ years of experience.
I focus on simplifying equity markets through technical analysis. On Trading View, I share easy-to-understand insights to help traders and investors make better decisions.
Kindly check my older shared stock results on my profile to make a firm decision to invest in this.
For any query kindly dm.
Thank you and invest wisely.

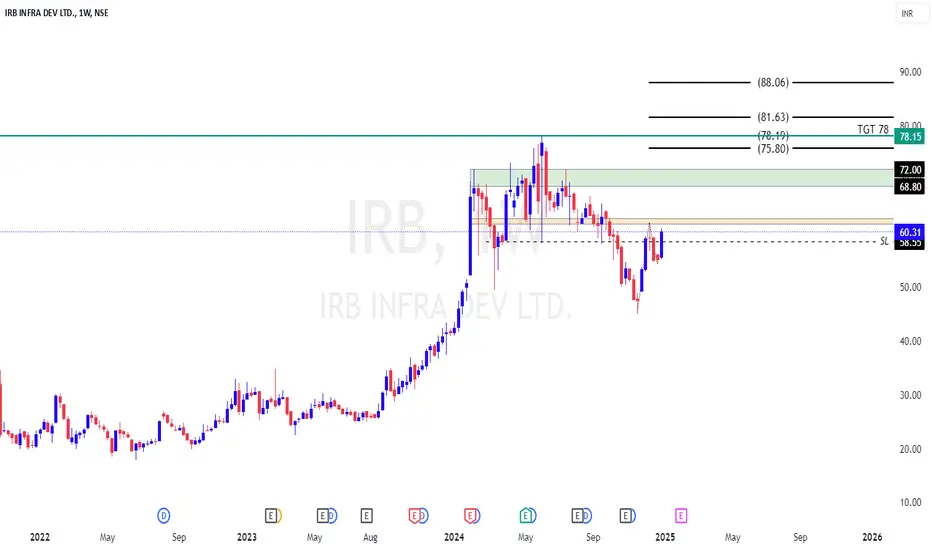
SWING IDEA - IRB INFRA DEVIRB Infrastructure Developers Ltd ., one of India's leading infrastructure development companies, is displaying technical signals that suggest a swing trading opportunity.
Reasons are listed below :
58 Zone as Strong Support: The 58 level has proven to be a crucial support zone, offering a strong foundation for potential upward movement.
Bullish Engulfing Candle on Daily Timeframe: The formation of a bullish engulfing candle indicates a surge in buying pressure.
200 EMA Support on Daily Timeframe: The stock is receiving solid support from the 200-day EMA, which strengthens the bullish outlook.
Volume Spike: A noticeable increase in trading volumes suggests strong investor interest and potential for a breakout.
Target - 72 // 78
Stoploss - daily close below 57
DISCLAIMER -
Decisions to buy, sell, hold or trade in securities, commodities and other investments involve risk and are best made based on the advice of qualified financial professionals. Any trading in securities or other investments involves a risk of substantial losses. The practice of "Day Trading" involves particularly high risks and can cause you to lose substantial sums of money. Before undertaking any trading program, you should consult a qualified financial professional. Please consider carefully whether such trading is suitable for you in light of your financial condition and ability to bear financial risks. Under no circumstances shall we be liable for any loss or damage you or anyone else incurs as a result of any trading or investment activity that you or anyone else engages in based on any information or material you receive through TradingView or our services.
@visionary.growth.insights

IRB INFRA S/R Support and Resistance Levels:
Support Levels: These are price points (green line/shade) where a downward trend may be halted due to a concentration of buying interest. Imagine them as a safety net where buyers step in, preventing further decline.
Resistance Levels: Conversely, resistance levels (red line/shade) are where upward trends might stall due to increased selling interest. They act like a ceiling where sellers come in to push prices down.
Breakouts:
Bullish Breakout: When the price moves above resistance, it often indicates strong buying interest and the potential for a continued uptrend. Traders may view this as a signal to buy or hold.
Bearish Breakout: When the price falls below support, it can signal strong selling interest and the potential for a continued downtrend. Traders might see this as a cue to sell or avoid buying.
20 EMA (Exponential Moving Average):
Above 20 EMA(50 EMA): If the stock price is above the 20 EMA, it suggests a potential uptrend or bullish momentum.
Below 20 EMA: If the stock price is below the 20 EMA, it indicates a potential downtrend or bearish momentum.
Trendline: A trendline is a straight line drawn on a chart to represent the general direction of a data point set.
Uptrend Line: Drawn by connecting the lows in an upward trend. Indicates that the price is moving higher over time. Acts as a support level, where prices tend to bounce upward.
Downtrend Line: Drawn by connecting the highs in a downward trend. Indicates that the price is moving lower over time. It acts as a resistance level, where prices tend to drop.
RSI: RSI readings greater than the 70 level are overbought territory, and RSI readings lower than the 30 level are considered oversold territory.
Combining RSI with Support and Resistance:
Support Level: This is a price level where a stock tends to find buying interest, preventing it from falling further. If RSI is showing an oversold condition (below 30) and the price is near or at a strong support level, it could be a good buy signal.
Resistance Level: This is a price level where a stock tends to find selling interest, preventing it from rising further. If RSI is showing an overbought condition (above 70) and the price is near or at a strong resistance level, it could be a signal to sell or short the asset.
Disclaimer:
I am not a SEBI registered. The information provided here is for learning purposes only and should not be interpreted as financial advice. Consider the broader market context and consult with a qualified financial advisor before making investment decisions.

Irb Infrastructure Developers LtdIrb Infrastructure Developers Ltd
Trade Analysis - Trendline breakout
Reason - Retest the breakout levels
Entry above the 64/65 levels
Target 20% it's around 14/13 points.

IRB Infrastructure - Buy & Hold for a Bullish MomentumTechnical Analysis of IRB Infrastructure
Overview of the Stock - The chart presents a technical analysis of IRB Infrastructure on a 1-hour timeframe. The analysis employs support and resistance levels derived from Fibonacci retracement, as well as potential buy zones.
Key Indicators
Fibonacci Retracement: The chart uses Fibonacci retracement levels to identify potential support and resistance areas.
EMA 200: The 200-period Exponential Moving Average (EMA) is plotted as a potential trend indicator.
Support and Resistance Levels: Horizontal lines indicate potential support and resistance levels.
Buy Zones: Two buy zones are highlighted:
Breakout Buy: A buy signal is suggested if the price breaks above the 67.69 level.
Reversal Buy: A buy opportunity is indicated if the price reverses from above the 62.31 level.
My Opinion about the IRB Infra Stock - The chart suggests a bullish bias for IRB Infrastructure. The price is currently trading above the 0.5 Fibonacci retracement level and the 200 EMA, indicating potential upward momentum.
Potential Trading Strategies:
Breakout Strategy: If the price breaks above the 67.69 resistance level with strong volume, it could signal a bullish breakout. Traders might consider buying with a stop-loss below the breakout level.
Reversal Strategy: If the price retraces to the 62.31 support level and shows signs of reversal (like a bullish candlestick pattern), it could be a potential buying opportunity. A stop-loss can be placed below the 62.31 level.
Disclaimer: This analysis is based solely on the provided chart and does not constitute financial advice. Always conduct thorough research and consider consulting a financial advisor before making investment decisions.

IRB INFRAIRBINFRA only above 73,
pure technical play,
above 73 it may touch quick 78-80.
Budget play as well all infra stocks are rising.

IRB infrairb in now some risky buy zone ...if you want to buy this share . you have to take some risky buy.. i am not much strong in this stocks to buy now.. as per my methode now littel risky buy. with low stop loss as what i mention in this chart

#irb swing or intraday Irb after long Consolation it may go up as we can see the stock is making higher high after brake up line you can take entry

IRB INFRASTRUCTUREThis stock breakout ATH resistance level and TGT will be up to 40% and SL will be 70 and This is only for educational purpose


IRB INFRA CMP 77
SL 68
TARGETS 20-25%
GOOD BASE FORMED WITH HIGH VOLUMES 7SHAKEOUT ALSO DONE ... very strong breaout candle

IRBLooks so good on Charts.
Cup & Handle pattern.
Good for Short term.
Target 88 ,112 .
Do Like ,Comment , Follow for regular Updates...
Keep Learning ,Keep Earning...
Disclaimer : This is not a Buy or Sell recommendation. I am not SEBI Registered. Please consult your financial advisor before making any investments . This is for Educational purpose only.


IRB INFRA Cup & Handle Pattern RSI above 60 Daily / Weekly / Monthly
Life Time is Breaking
Volume need to increase
EMA in line
sustain above 73 and hold
expected level 82 then 98
support 63

Breakout in IRB InfrastructureStock Analysis
IRB Infrastructure is showing a clear uptrend.
The stock has just given a breakout with higher volume, indicating strong buying interest.
Trading Strategy
Swing Trading Setup: Ideal for a simple swing trading approach.
Target and Stop Loss: Levels are plotted on the chart for easy reference.
Consider this setup for a straightforward and potentially profitable swing trade. Trade wisely and follow your plan!

Ascending triangle pattern on IRBIRB formed an ascending triangle pattern on daily chart. Initially at a glance it looked like a triple top formation but clear support levels indicates its ascending triangle. Also there was a spike in volume on breakout day indicating strong buyers out there. Stop loss can be held just below the breakout candle with target the width of the broader triangle. Good risk reward ratio as well.
Hope you liked this idea, if so please boost this idea so others could benefit or leave a comment on what you think. I'll be glad to hear from you. Otherwise happy trading :-)

IRB INFRASTRUCTURE
IRB Infrastructure stock looks attractive because in the last quarter, the company showed very good results and is forming a VCP pattern

IRBBUY CMP
Stop loss. 58
Target 108
Market Cap: ₹ 40,582 Cr
Current Price: ₹ 67.2
High / Low (52 Week): ₹ 72.0 / ₹ 25.0
P/E Ratio: 74.2
Dividend Yield: 0.30%

IRBnow near support if hold 30 level continue than again upside move possible
below 29 some weakness possible
cmp 30.80
resistance near 34-35 above this open for 38-42-45++
