IRCTC CHART ANALISYS 2025Market Now Not UP TREND PLZ Wait For TREND Moves,
Supports and Resistance Respect
IRCTC STRONG STOCK
A market trend refers to the general direction in which the price of financial instruments (stocks, indices, commodities, etc.) moves over a specific period. Market trends can occur in any time frame, such as short-term (intraday), medium-term (weeks to months), or long-term (years). Understanding market trends is crucial for traders and investors to make informed decisions. Here's a detailed description of market trends:
Technical Indicators of a Bullish Trend in IRCTC
Higher Highs and Higher Lows
Consistently forming higher highs and lows on the price chart, signifying strong buying interest.
Moving Average Crossovers
The 50-day moving average crossing above the 200-day moving average ("Golden Cross") is a positive signal.
Volume Surge
Higher trading volumes on up days indicate strong participation and conviction among buyers.
Momentum Indicators
IRCTC trade ideas

in irctc we can show best support 800 in irctc we can show best support 800 and target up to 1200 ++

IRCTCIt follows a good trend throughout this year. Look for a break either side and trade accordingly. Please do your own analysis before entering a trade. Pls boost the post if you find this post helpful.

IRCTCNSE:IRCTC
Deatails of IRCTC
Rs>40
once cross 10 days MA by
20 MA
Maintain SL 756
Short Term Target - 1000++

IRCTC Breakdown Trading StrategyThe stock price of IRCTC has fallen below major support levels and currently offers good positional opportunity.
The business has a monopoly and the current news flows had impacted the sentiments negatively.
The news impact seems to be over and the stock is prepared to perform.
Note: The idea shared is aimed at spreading practical awareness of the theoretical concept of Breakdown Trading Strategy. Do not make any financial commitments based on this.

IRCTC Weekly Analysis: Bearish Setup Ahead of Results
IRCTC’s stock is showing signs of weakness on the weekly timeframe, with a clear head-and-shoulders pattern that suggests potential downside risk. Currently trading around 831, IRCTC is facing resistance at the 847 level, which acts as a critical barrier for bulls. A close above this level on a weekly basis would be needed to invalidate the bearish outlook, potentially reversing the trend. However, if IRCTC fails to reclaim 847, we could see increased selling pressure in the coming sessions.
With earnings results due on November 4th, there is added uncertainty in the market. If the results disappoint, the stock could break further down, targeting the Fibonacci support levels around 806, 778, and potentially as low as 730. Each of these levels aligns with key Fibonacci retracements, offering possible points where buyers might step in.
For investors and traders, caution is advised as we head into the results. A sustained move below 847 could open up substantial downside risk. Bulls will need a strong catalyst from the earnings report to push the price back up and change the trend. Watch these levels closely, and manage your positions accordingly.

Irctc buyIrctc break a long term trendline, look for ready to upmove, buy above 935, target 1000, 1050, sl 900

IRCTC on important levl.. Here's the analysis.... •IRCTC 🚄🚄in a range of 750 points since sep 2021 on monthly chart.
•Consolidation at .5🧐 level of the range after a good breakout in Jan 24.
•Indian Railway is upgrading it's Stations in manny cities.
•It's been on the golden crossover on daily chart 📈.
•A good breakout volume breakout with the trend line breakout makes the trgt prices of 1.9k to 2k

IRCTCIRCTC
CMP
Possible breakout candidate
At major support
Wait for trndline breakout and retest for entry

IRCTC Reverse Head and Shoulder Break OutIRCTC has broken out over the neckline of Reverse Head and Shoulder Pattern.
Refer the chart to get more clarity over the levels.

IRCTC chart analysisIRCTC chart analysis on daily time frame. This looks like at good support level.
Please share your feedback.

More downside to IRCTC??IRCTC has formed a descending triangle pattern. A break below the support line could bring more downside

IRCTC long IRCTC closing above 910 with good volumes could again touch 1280-1300 levels. Could be a good long term stock..

IRCTC Ltd intraday level for 23rd Aug #IRCTC IRCTC Ltd intraday level for 23rd Aug #IRCTC
Buying may witness above 943
Support area 936. Below ignoring buying momentum for intraday
Selling may witness below 929
Resistance area 936
Above ignoring selling momentum for intraday
Charts for Educational purposes only.
Please follow strict stop loss and risk reward if you follow the level.
Thanks,
V Trade Point

IRCTC intraday level for 22nd Aug #IRCTC IRCTC intraday level for 22nd Aug #IRCTC
Buying may witness above 938
Support area 929. Below ignoring buying momentum for intraday
Selling may witness below 929
Resistance area 938
Above ignoring selling momentum for intraday
Charts for Educational purposes only.
Please follow strict stop loss and risk reward if you follow the level.
Thanks,
V Trade Point

IRCTC: Strong Q1 Performance and Key Technical Levels to Watch💰 IRCTC reports a 32.5% increase in net profit for Q1 FY25, indicating strong growth
🔄 Wait to Retrace from major support level
📈 Potential bullish breakout above 955, with resistances at 1002, 1057, and 1139
📉 Watch for bearish breakout if support fails
📊 Follow for analysis!

buy at zone - swing / intradayENTRY
- lines marked below is potential reversal zone ( PRZ)
- entry is strictly inside the zone
- look for buying confirmation in smaller time frame ( 15 minutes preferred )
EXIT
1. target
- mark fib retracement from C to latest swing low
- TGT 1 - 0.236 fib level (intraday )
- TGT 2 - 0.382 fib level
- TGT 3 - 0.5 fib level ( preferred target )
2. SL
- candle close below (PRZ)
- if u didn't get confirmation inside the zone , ignore this pick
- if candle close is below zone , this pattern becomes invalid . IGNORE THIS PICK
- RE-ENTRY can be done , if u again get buying confirmation inside the zone

IRCTC - SHORT - WEEKLYIRCTC Weekly view is Bearish
Short RR 1:1.5
One Can hold Short position
TARGET : 760

IRCTC-Swing Trade- Will this stock drop to next bullish station?NSE:IRCTC NSE:IRCTC
13.07.2024
Buy above 1059
Target 1128
Stop Loss 990
Risk Reward: 1:1
1. Inside breakout. But wait for high to break for entry
2. Strong Resistance turned support level. 4th Retest failed at the same level.
3. Price rejection from 200 EMA % found fake breakout at key support level
4. 21 & 50 EMA Crossover. Price above both level
5. Price has crossed 0.618 downward Fibonacci level also rejected two times
from 0.5 Level indicating end of downtrend.
6. Rejection from bullish fair value gaps
7. Increased volumes in green candles compared to bearish candles

IRCTC - Looks good for long termAs per my analysis., IRCTC can be added for investment
Buy zone 642 to 741.10 with SL of 637.
First Target will be 855
Second Target 970
Third Target - 1100+
Please comment if you wish to see my analysis for any stocks.
Please do your due diligence before trading or investment.
Thank you.

IRCTC LongAs per the Indicator IRCTC was in resting period from 4th June to 2nd July and now the movement has started. In the next 30-40 days it can possibly move by 8-10%. I have taken IRCTC!!

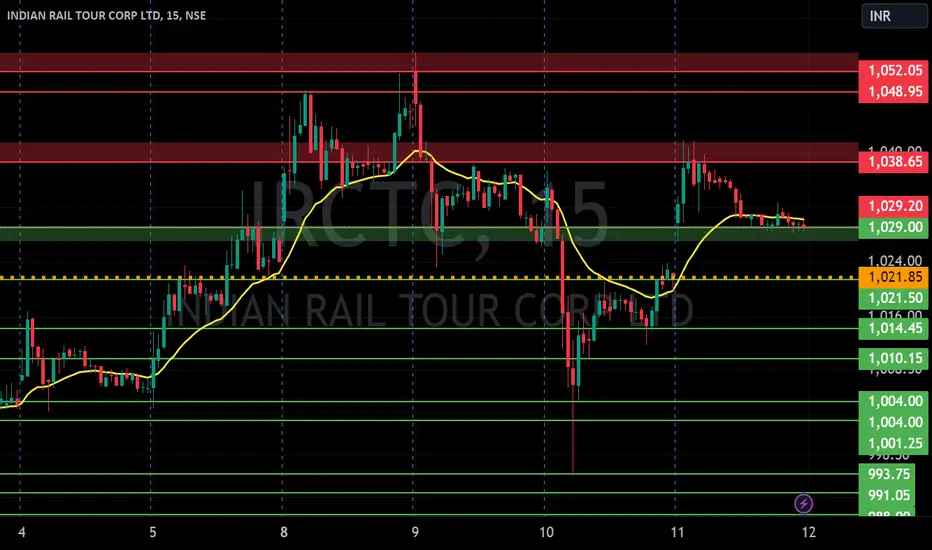
IRCTC S/R for 12/7/24Support and Resistance Levels: In technical analysis, support and resistance levels are significant price levels where buying or selling interest tends to be strong. They are identified based on previous price levels where the price has shown a tendency to reverse or find support.
Support levels are represented by the green line and green shade, indicating areas where buying interest may emerge to prevent further price decline.
Resistance levels are represented by the red line and red shade, indicating areas where selling pressure may arise to prevent further price increases. Traders often consider these levels as potential buying or selling opportunities.
Breakouts: Breakouts occur when the price convincingly moves above a resistance level (red shade) or below a support level (green shade). A bullish breakout above resistance suggests the potential for further price increases, while a bearish breakout below support suggests the potential for further price declines. Traders pay attention to these breakout signals as they may indicate the start of a new trend or significant price movement.
20 EMA: The yellow line denotes 20 EMA, to interpret the 20 EMA, you need to compare it with the prevailing stock price. If the stock price is below the 20 EMA, it signals a possible downtrend. But if the stock price is above the 20 EMA, it signals a possible uptrend.
Disclosure: I am not SEBI registered. The information provided here is for learning purposes only and should not be interpreted as financial advice. It is important to consult with a qualified financial advisor before making any investment decisions. Tweets neither advice nor endorsement.
Will IRCTC hit 1100 ?Stock Update - *IRCTC cmp 1036*
Company announced DMRC, and CRIS collaborated to promote the 'One India – One Ticket' initiative
Impact - Positive
*Buy IRCTC with the extended Target of 1088*
Support 984 - 993
