ITC going to dig a holeSee ITC has taken retest of blue trendline ,200 sma and Sup/Resistance zone .
So if we take precaution then if it goes below 340 and retest at red trendline, there is going to be rapid hole 513
STAY Tuned for updates
ITC trade ideas

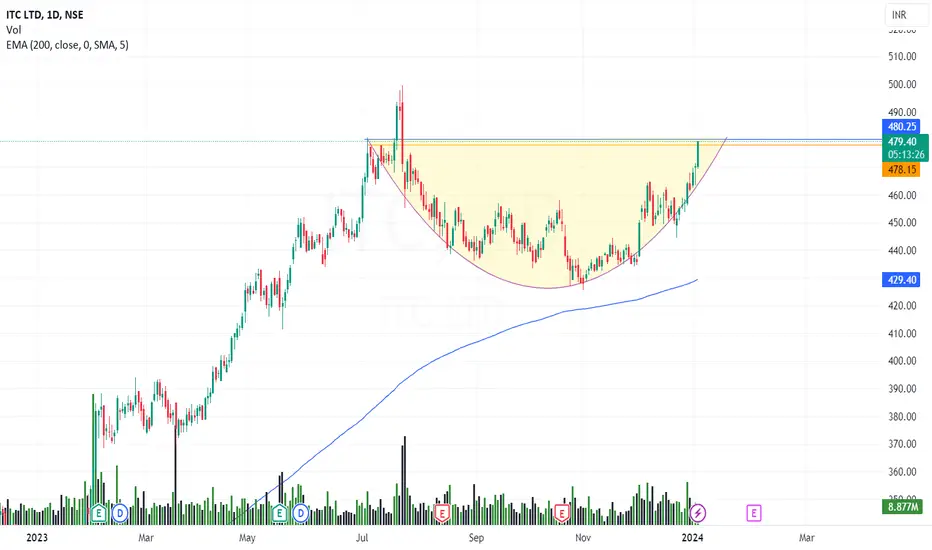
ITC on next moveITC made a base at 424 and is prepared for next move.
a move above 482 is good to enter
We can see 600 levels in ITC in next year.
stop loss is 424

Still there are bulls ready to backup in ITCWe can see trendline and extran crucial support zone have stopped ITC from a freefall.
If any bad news or rumors does not come there will a bull or trapping in these Trend lines and the next resistance

ITC MIGHT GET BULLISHITC at critical support might give a good up move with small STOPLOSS good for swing and positional trade
Entry : above 442
Stop loss : 437 (can trail to 440 if sustains above 445)
Target: 450, 458, 465++
(Might go above 500 for positional)
Note- I'm not sebi registered this is my personal view

ITC--@Trendline Support ??This stock is taking the support of trendline multiple times and now price is at support level.
If this trendline acts as support again price is bullish and test the resistance trendline.
If failed then look for short side on retracement.

ITC new runITC can start a new run after results if holds 435 levels..
Buy in 4440-445 range with 435 stop los short term or 425 medium term with a target of 500 to 530 levels..

Should we buy ITC now?
My indicator is showing that current swing on the down side has ended . I think, if ITC is green tomorrow, i would like to take a position in this. Please share if you think otherwise.


ITC Ltd : Clear Breakout Above 457 with SL 448ITC Ltd
Clear Breakout Above 457
Buy Above 457-460
Stoploss : 448
Target : 464-472
Holding : 1-2 Month
Disclosure : I am not SEBI registered.The information provided here is for education purposes only.I will not be responsible for any of your profit/loss with this channel suggestions.Consult your financial advisor before taking any decisions.

itc, this is also one of the potential stock.itc, same for this also, if shows some positive movement, can go long in it with new low as stoploss. if it continues uptrend then enjoy the uptrend ride. thanks for giving your valuable time to see my analysis.
do share your views in comments, thanks.

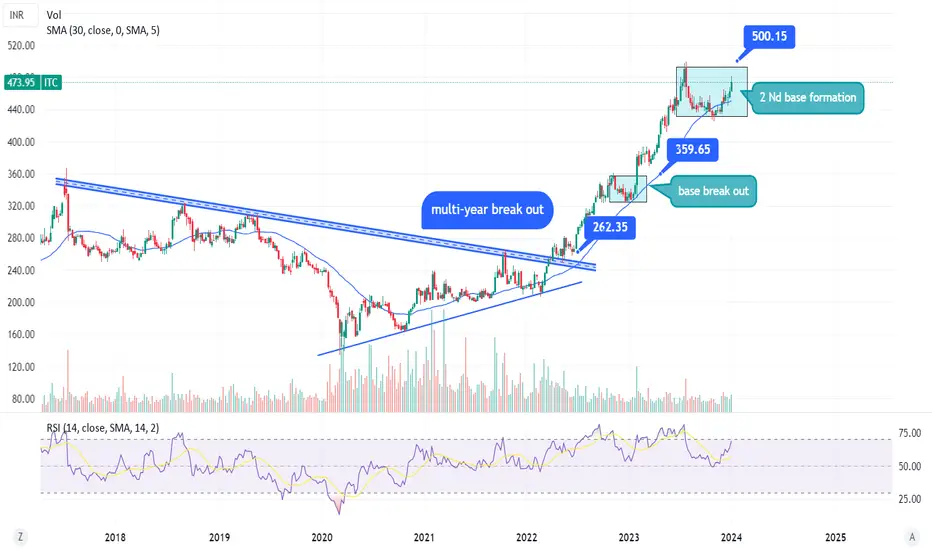
THE ITC SAGA (A MULTI BAGGERS TREND ANYALISIS)The ITC saga after a multi-year break the stock price doubled from 250 to a high of 500 during this phase the stock started to form strong bases and break out of the bases have been strong in the past with 35% rally in the last base
ITC SWING tradeMonday view face resistance at 480, check for support area to buy , two support zones

ITC - Long Setup , Move is ONStock name = ITC Limited.
✅ #ITC trading above Resistance of 480
✅ Next Resistance is at 498
Daily chart setup
Chart is self explanatory. Levels of breakout, possible up-moves (where stock may find resistances) and support (close below which, setup will be invalidated) are clearly defined.
Disclaimer: This is for demonstration and educational purpose only. this is not buying and selling recommendations. I am not SEBI registered. please consult your financial advisor before taking any trade.

ITC AT IMP SUPPORTItc gave nice break out at 438-40 and now consolidated near crucial resistance.. and can give a good returns if breaks 458
Right now one can enter above 452 with SL of 444 for swing or go long till 500 or above levels
I'm not sebi registered.. it's my own idea or strategy.

ITC Break the Strong ResistanceITC cmp.479 Break the Strong Resistance If sustain Above 480 More upside seen possible target for 498-520-543

ITC Lokking good for long termStart accumulating the stock cause it’s taken support from the Weekly trendline yet again.
Just watch how it reacts near 450-452 zone, and act accordingly.
Happy Trading !!!

in & Out - Swing Trade Scenario 1 - If stock opens positive and move towards high then wait for the strong resistance and look for shorting opportunity
Scenario 2 - If stocks opens negative and move towards lower side then wait for the support and take entry when the support gets break.

ITC ITC chart in symmetrical triangle finished. and now going on bullish flag pattern.
its telling strong up trend.

A SIMPLE STRATEGY FOR ITC ALONG WITH LIVE CHART FOR BACKTESTINGdISCLAIMER! THIS ANALYSIS AND STRATEGY IS MADE FOR EDUCATIONAL PURPOSE AND DO NOT CONSIDER AS AN INVESTMENT ADVICE.
Hey Folks!
In this Idea i am going to introduce my new concept of trading which is more objective based rather that subjective.
As the Title suggest that it is going to be a very simple strategy with specific entry point and stoploss moreover i will be sharing a live link to the chart that will help you too back test this strategy, and in the live chart there will also be my custom indicator that will guide a direction of a trend.
One be one i will add the working of the strategy as an update to the idea because there are multiple ways to use this strategy but as i said i will provide one setup that will work in the most simplest way.
The first simplest method.
Buying Point = Lower level of the Green Zone
Initial Stoploss= Lower level of the Red Zone which is just below the entry point.
Trailing Stoploss = Middle point Of the Red Zone which is just below the entry point.
Target = 1:2 , 1:4 and 1:8
Soon I will Show an example by adding a Snapshot as an update to this Idea.
So Staytuned.

ITC Bullish Pattern
Hello All,
I am glad you have liked my post and I am sure everyone who have traded on these post would have made profits.
If you like my Idea, Don't forget to Boost and comment on my Analysis.. The recommendations are purely for educational purpose only, consult you financial advisor before trading.
Gautam Khanna
Technical Analyst by Passion :-)

ItcStock name = Itc Limited.
Daily chart setup
Chart is self explanatory. Levels of breakout, possible up-moves (where stock may find resistances) and support (close below which, setup will be invalidated) are clearly defined.
Disclaimer: This is for demonstration and educational purpose only. this is not buying and selling recommendations. I am not SEBI registered. please consult your financial advisor before taking any trade.
