Has ITC refueled its tank for the next move up?The ITC stock now has been consolidating for more than 2 weeks at a very strong support/demand zone of INR430-435.
This particular S/R zone is an active zone for the stock since May 2023, acting as support and resistance on several occasions since May.
There was a slight breach of the zone in Oct.end which was successfully reversed by the excess demand hence providing more relevance to this zone.
It is very interesting to witness the stock making a 2-week range right at the demand zone of 430-435 as if it is only waiting for an explosion upwards towards the supply zone of 450-455.
Surely the sellers/bears have tested the buyers/bulls enough and the buyers have bravely stood their ground even bringing the stock back above 430 after the breach, but now its time for the buyers to test the sellers. We shall see if they hold their ground of 450-455 or flee from the battleground.
CMP 437
SL 432
TARGET 457
ITC trade ideas

ITC for 6 to 8 months target As per my knowledge I did price action and it came out that it is trend reversal major resistance is 1st resistance of 456 and if it breaks and retest you can see levels of 494- 500
Below side you have support of 200 moving average the line in red that is 429 and if it breaks the below target is 411

ITCThese are swing ideas which you can add your watchlist and analysis for yourself !
Keep on your radar 📡
This content only education purpose!
❗I am not sebi ragister❗

Analyzing ITC Stock Using Fibonacci Chart: ShortfallIn this analysis of ITC's stock using the Fibonacci chart, we identify a potential "shortfall" in the stock's performance.
First Target at 412.6: The "first target" is a price level at which the trader or investor hopes to sell their ITC shares to lock in profits or limit losses. In this case, the first target is 412.6, which means the trader is looking to sell ITC shares if the price reaches this level.
Second Target at 392.15: This is a lower target, indicating that if the stock price continues to decline, the trader plans to sell their ITC shares at this price to mitigate losses.
Stoploss at 440: A "stoploss" is a price level at which a trader will sell their shares to limit potential losses. In this case, the stoploss is set at 440, meaning that if the stock price rises to or above this level, the trader will buy their ITC shares to cut their losses.
This information is often used in technical analysis and trading strategies to manage risk and potential gains when trading stocks. However, it's essential to remember that stock prices can be highly volatile, and there are no guarantees in trading or investing. It's crucial to make informed decisions based on thorough research and risk management strategies. It's also advisable to consult with a financial advisor or do your own research before making any investment decisions.

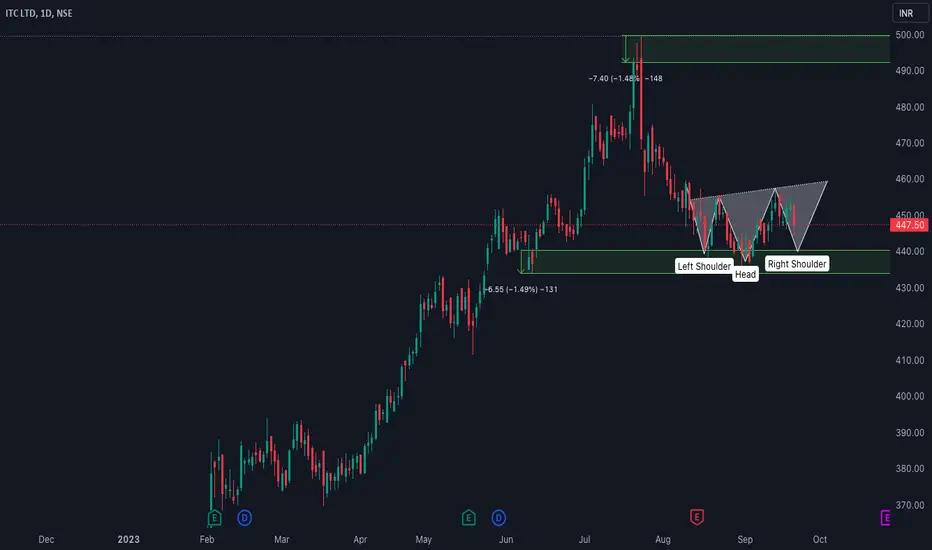
I T C BULLISH WITH W PATTERNITC Q2 Results Live Updates: Net profit to rise on strong FMCG, hotels biz; cigarette volume growth seen at 5% YoY

ITC BullishThe Support and Resistance is shown on the chart.
The price action is showing bullish signs.
The trend can be seen on the chart.
The RSI is 58.28
The Earning release is on 19th October.
Disclaimer: This chart and it's analysis is for educational purpose omly. Trade according to your own analysis.

I T C Breakout bullishBreak the resistance at 457 this level go for buy side
BUY 457
SL 444
1 Target 480
2 Target 500
Tip

IMPORTANT LEVELS FOR THE MONTHNSE:ITC BSE:ITC
All these levels are for upside move, until price is holding these levels try to look for long position on every level.
I am expecting a upside momentum.
These levels are so simple so don't get confused .
If you are looking for the short entry then enter near or at the level or if you are planning long then also plan it near or at the level. It will help to minimise stoploss.
My view is long and buying on dip is a ideal strategy until it falls below the levels.
I will try to update these levels if it is required.
All the best folks.

ITCITC finding Support ah the 2023 June High Price level...Looking Good..
If this Price sustain Upside is hopefull

ITC Double bottom on chart
RSI Bullish diverge
MACD Bullish diverge
Also price above 20 & 50 DEMA
Entry when stock trend line breakout
Wait for confirmation
Disclaimer This is my personal view for education purpose only
No Buy sell recommendations.

ITC making W pattern ready for 500 + again On Our Harmonic pattern indicator based trade setup take trade as explained below :-
Early trades Buy or sell below/ above 23.6 %, safe trades buy or sell above / below 41% , after taking trade next upside or downside levels will be target ,
When reverse buy or sell signal appear then book profit on Target or trail SL to 23.6 % If trailing SL hit then early trade can be taken above or below 23.6 and safe trade can b taken above/ below 41% ..
Please note:-
It's working on news based and volitile market very well so exit if SL hit

ITC is on its major supportITC is at its main support level. A good rise in ITC can be seen from here. This stock can give about 4 to 5 percent profit in the next one to two weeks.

ITC50 movieng average dawn trading stock.
Support broken !
I am not SEBI Register.
Add your watchlist and yourself analysis.
Only education purpose!


Intraday ITC view for today 27th september WednesdayIntraday ITC view for today 27th september Wednesday
Selling opportunity below 339
stop loss range above 443-444
Follow strict risk reward and stop loss if you follow the level...
Charts for Educational purposes only.
Thanks,
V Trade Point

🚀 "ITC: Igniting a 1:4 Risk-to-Reward Breakout!" 📈💥🚀 "ITC: Primed for Explosive Gains with a 1:4 Risk-to-Reward Breakout!" 📈💥
Prepare for ITC's stock to potentially soar as it breaks free from a bullish descending triangle pattern, flaunting a compelling 1:4 risk-to-reward ratio. 🌟💰
Calling all traders! 🗓️ This breakout could be your ticket to substantial portfolio growth. Delve into our comprehensive analysis and expert insights to ride this viral market trend. 💡📊
📚 Let's simplify the breakout: Picture a stock's price consolidating within a triangle, with lower highs and a flat support line. When it bursts out of this pattern, it's like a rocket taking off, potentially leading to significant gains.
⏳ The risk-to-reward ratio is your profit compass! It ensures that your potential reward outweighs potential loss, allowing you to thrive even if some trades turn against you.
📉 Remember, trading success involves managing losses intelligently, so your wins overshadow them. Join us on this journey to financial prosperity, where strategic analysis and risk management reign supreme. 🚀💸📈
🔔 If you're ecstatic about the ITC breakout, show your support! Hit that like button and share the news with fellow traders, inspiring them to seize this golden opportunity in the stock market. 🌍💥💻

ITC shall hit support againThe chart clealry shows that ITC will hit its support marked in chart once again before making any up or down move .
One can wait for this level to reach to take a call.


Itc uptrendBullish on itc
Short term upside of 15%
Channel pattern in weekly charts...taken reversal from 20 ema

Trading Idea: Long-term Investment in ITC Limited (NSE: ITC)Overview:
ITC Limited, a prominent Indian conglomerate, operates across diverse sectors, including FMCG, hotels, agri-business, and cigarettes. This trading idea suggests considering a long-term investment in ITC based on a combination of fundamental and technical analysis.
Fundamental Analysis:
Revenue Diversification: ITC has made significant strides in diversifying its revenue streams beyond its traditional tobacco business. The FMCG (Fast-Moving Consumer Goods) segment, particularly brands like "Aashirvaad" and "Classmate," has shown promise.
Earnings Growth: Analyze ITC's historical earnings growth and projections for the future. Check for consistency in revenue and profit growth over the years.
Dividend Yield: Consider ITC's dividend history and dividend yield. The company has a track record of paying dividends to shareholders.
Valuation: Evaluate ITC's current valuation metrics, such as the Price-to-Earnings (P/E) ratio, in comparison to peers in the industry.
Market Position: Assess ITC's competitive position in its various business segments and its market share.
Technical Analysis (Up to 2023):
Trend Analysis: Review ITC's historical stock price trends. Look for patterns or trends that suggest a potential reversal or continuation. Use technical indicators like Moving Averages, Relative Strength Index (RSI), and MACD to gauge the stock's momentum.
Support and Resistance Levels: Identify key support and resistance levels on the stock chart. These levels can provide insights into potential entry and exit points.
Candlestick Patterns: Pay attention to candlestick patterns to spot potential reversals or trend continuations.
Volume Analysis: Analyze trading volumes alongside price movements. Unusual volume spikes can indicate significant market interest or potential trend changes.
2023 Outlook:
Given the diverse nature of ITC's business segments, its performance may be influenced by various factors, including economic conditions, consumer preferences, and regulatory changes. Monitor updates related to its FMCG business, hotel segment, and any developments in its traditional tobacco business.
Risks:
Regulatory changes in the tobacco industry can impact ITC's revenue and profitability.
Competitive pressures in the FMCG sector.
Economic factors, including inflation and consumer sentiment.
Conclusion:
Investing in ITC Limited (NSE: ITC, BSE: ITC) should be based on thorough research, a long-term perspective, and a well-defined investment strategy. Monitor both fundamental and technical factors, and consider your risk tolerance before making any investment decisions.
