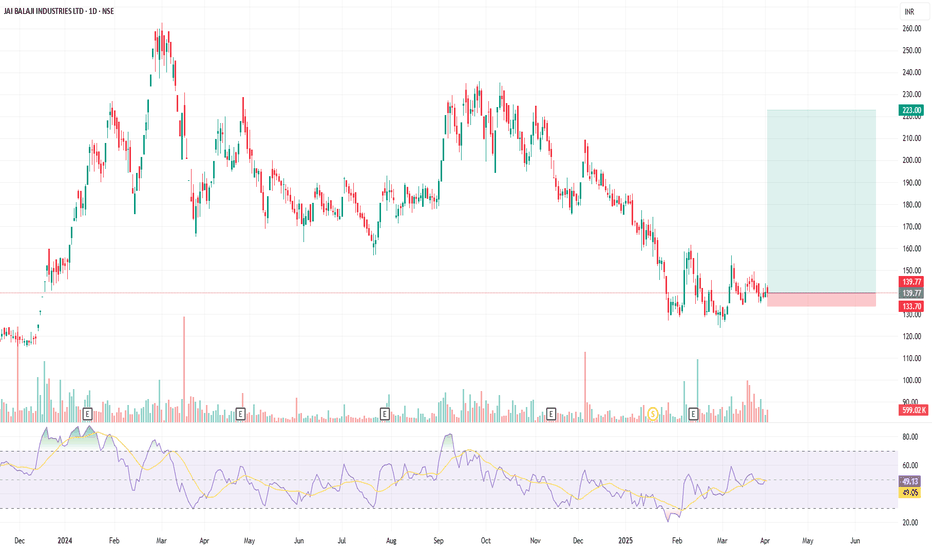
Solid trade idea for Jai Balaji Industries Ltd (NSE: JAIBALAJI)Chart Summary 📊 (as of April 2, 2025)
Current Price: ₹139.77
Support Zone : ₹132–₹134 (marked in red on your chart)
Resistance Zone: ₹150–₹155 (immediate), then ₹175+
RSI: 49.05 — Neutral, poised for either reversal or consolidation breakout
Structure : Sideways consolidation after a strong downtrend; forming a potential base
Trade Idea 🛠️: Positional Swing Trade (Risk-Reward Based)
Buy Zone ₹138 – ₹141
Stop Loss ₹133.70 (as per chart)
Target 1 ₹155
Target 2 ₹175
Target 3 ₹223 (as per chart idea)
Risk-Reward ~1:3 (excellent)
Why This Setup Looks Good ? 🎯
✅ Price holding above key support (~₹134) for several sessions
✅ RSI is stabilizing near 50 — ideal for pre-breakout build-up
✅ Volume remains in check — accumulation possible
✅ Reward-to-risk ratio is favorable if SL holds
🔔 Trigger for Entry
You can enter gradually in the ₹138–₹141 zone
Watch for a break above ₹143–₹145 with volume → confirms breakout
Avoid trade if price closes below ₹133 with red candle and volume
JAIBALAJI trade ideas
JAI BALAJI INDUSTRIES LTD S/R Support and Resistance Levels:
Support Levels: These are price points (green line/shade) where a downward trend may be halted due to a concentration of buying interest. Imagine them as a safety net where buyers step in, preventing further decline.
Resistance Levels: Conversely, resistance levels (red line/shade) are where upward trends might stall due to increased selling interest. They act like a ceiling where sellers come in to push prices down.
Breakouts:
Bullish Breakout: When the price moves above resistance, it often indicates strong buying interest and the potential for a continued uptrend. Traders may view this as a signal to buy or hold.
Bearish Breakout: When the price falls below support, it can signal strong selling interest and the potential for a continued downtrend. Traders might see this as a cue to sell or avoid buying.
MA Ribbon (EMA 20, EMA 50, EMA 100, EMA 200) :
Above EMA: If the stock price is above the EMA, it suggests a potential uptrend or bullish momentum.
Below EMA: If the stock price is below the EMA, it indicates a potential downtrend or bearish momentum.
Trendline: A trendline is a straight line drawn on a chart to represent the general direction of a data point set.
Uptrend Line: Drawn by connecting the lows in an upward trend. Indicates that the price is moving higher over time. Acts as a support level, where prices tend to bounce upward.
Downtrend Line: Drawn by connecting the highs in a downward trend. Indicates that the price is moving lower over time. It acts as a resistance level, where prices tend to drop.
Disclaimer:
I am not a SEBI registered. The information provided here is for learning purposes only and should not be interpreted as financial advice. Consider the broader market context and consult with a qualified financial advisor before making investment decisions.
JAIBALAJI : uplift is coming?1. Jai Balaji Industries Ltd
Analysis:
Wave Structure: Identifies an Elliott Wave correction (ABC structure). Wave C is nearing completion in the 860-841 INR zone.
Buying Range: Highlighted between 860-841 INR.
Target Zone: Marked at 1218-1261 INR, suggesting strong upside potential.
Stop Loss: Defined at 817 INR, just below the buying zone.
Trading Plan:
Action: Place buy orders in the range of 860-841 INR using a staggered accumulation strategy.
Stop Loss: Set at 817 INR to account for potential false breakdowns.
Targets:
First Target: 1218 INR.
Final Target: 1261 INR.
Reasoning:
Wave C completion near the buying range suggests a potential reversal.
Targets align with historical resistance levels, making them logical profit zones.
Jai Balaji Industries LtdThe Co has a diverse portfolio of value-added products including DRI (Sponge iron), Pig iron, Ferro Alloys, Alloy and Mild Steel Billets, Reinforcement Steel TMT Bars, Wire Rods, Ductile Iron Pipes, and Alloy and Mild Steel Heavy Rounds.
Breakout with good Volume - Targets mentioned in the chart keep SL @ 75
Market Cap
₹ 1,286 Cr.
Current Price
₹ 85.4
Stock P/E
22.2
Book Value
₹ 38.2
Dividend Yield
0.00 %
ROCE
13.3 %
ROE
%
Face Value
₹ 10.0
Promoter holding
58.7 %
EPS last year
₹ 3.98
EPS latest quarter
₹ -0.90
Debt
₹ 860 Cr.
Pledged percentage
57.3 %
Net CF
₹ 11.3 Cr.
Price to Cash Flow
4.01
Free Cash Flow
₹ 229 Cr.
Debt to equity
1.55
OPM last year
4.18 %
OPM 5Year
3.18 %
Reserves
₹ 411 Cr.
Price to book value
2.23
Int Coverage
2.18
PEG Ratio
1.25


