Review and plan for 21st February 2025Nifty future and banknifty future analysis and intraday plan.
Few stocks analysed.
This video is for information/education purpose only. you are 100% responsible for any actions you take by reading/viewing this post.
please consult your financial advisor before taking any action.
----Vinaykumar hiremath, CMT
JBMA trade ideas

A NEAR PSYCHOLOGICAL SUPPORT SEEN IN NSE: JBMA AUTO 🔸️A technical analysis of JBM Auto Ltd. (NSE: JBMA), outlining a long-term investment plan with an investment period of 3-5 months. Here's a breakdown of the levels and strategy:
✅️Entry Timing: Wait for the price to either approach ₹1,389 for an optimal entry or confirm an upward breakout.
☑️Entry: ₹1,389.10
🔴Stop Loss: ₹1,352.30
🔰Targets:
🟠TP1: ₹1,449.90
🟡TP2: ₹1,499.85
🔵TP3: ₹1,606.25
🟢TP4: ₹1,681.00
♻️Holding Period: 3-5 months.
🚰Strategy: Buy near ₹1,389, use stop loss, and book profits gradually at targets.
🔴Disclaimer:
I am not SEBI registered. This information is purely for educational purposes and not financial advice. The securities market is subject to market risks; please do your own research...
If you like this idea like share amd subscribe @Alpha_strike_reader

SWING IDEA - JBM AUTOJBM Auto , a leading manufacturer of auto components and systems, is showing promising technical indicators for a potential swing trade.
Reasons are listed below :
Strong Support at 1700 : The 1700 level has proven to be a robust support zone, indicating strong buying interest and a solid base for potential upward movement.
'W' Pattern Formation : The stock is forming a 'W' pattern (double bottom) at this crucial support zone, which is a bullish reversal pattern suggesting that the downtrend may be over and a new uptrend could be beginning.
Golden Fibonacci Support : The price has found support at the 0.618 Fibonacci retracement level, often considered a strong support zone and indicating a potential reversal or continuation of the uptrend.
Trading Above 50 and 200 EMA : JBM Auto is trading above both the 50-day and 200-day exponential moving averages, indicating a strong and sustained uptrend.
Constant Higher Highs : The stock has been consistently making higher highs, reflecting ongoing bullish sentiment and a sustained uptrend.
Target - 2430
Stoploss - weekly close below 1670
DISCLAIMER -
Decisions to buy, sell, hold or trade in securities, commodities and other investments involve risk and are best made based on the advice of qualified financial professionals. Any trading in securities or other investments involves a risk of substantial losses. The practice of "Day Trading" involves particularly high risks and can cause you to lose substantial sums of money. Before undertaking any trading program, you should consult a qualified financial professional. Please consider carefully whether such trading is suitable for you in light of your financial condition and ability to bear financial risks. Under no circumstances shall we be liable for any loss or damage you or anyone else incurs as a result of any trading or investment activity that you or anyone else engages in based on any information or material you receive through TradingView or our services.
@visionary.growth.insights

SWING IDEA - JBMAMACD is going to cross pretty soon in the coming days.
Once Cross is done, should open new entry levels for next leg up.
Good chance the stock can easily retouch its Swing High.
Try to take entries only after MACD Cross completes successfully.
Stock's fundamentals looks promising too.

JBM Auto Ltd getting ready for next leg up
sales and earnings have been rising for several quarters
Price action suggests an potentially explosive move on the cards, large outside candle followed by two inside candles on weekly TF
Volume and volatility has also contracted
Good Relative Strength
Previous upmove in jan was from a similar base (18Wks/ 30%) in which the stock is in right now
I will look to enter above 2070 initial stop: close below 50 DMA

Trade Alert for JBMA (JBM Auto Ltd.)Trade Setup:
- Action: Go Long (Buy)
- Entry Point: Above 2142.60
- This is the trigger point for initiating a long position, indicating that the price needs to break above this level to confirm the bullish setup.
Key Levels:
- Fibonacci Resistance Level: 2136.75
- This is a critical level derived from Fibonacci retracement or extension tools, suggesting a significant point of resistance. The price needs to surpass this level to confirm bullish momentum.
- Upside Targets:
- First Target: 2265
- Second Target: 2428
- These targets provide potential profit-taking points as the price moves higher.
Risk Management:
- It's essential to have a risk management strategy in place. This includes setting stop-loss levels to minimize potential losses if the trade does not go as anticipated. The exact stop-loss level can vary depending on your risk tolerance, but it should be placed below the entry point (e.g., below the Fibonacci resistance level at 2136.75).
Summary:
1. Go Long above 2142.60: Wait for the price to break and sustain above this level before entering the trade.
2. Monitor Resistance: Pay attention to the price action around the 2136.75 Fibonacci resistance level to ensure a clean breakout.
3. Upside Levels: Target prices at 2265 and 2428 for potential profit-taking.
4. Risk Management: Use stop-loss orders to protect against downside risks.
By following these guidelines, you can structure your trade with a clear plan for entry, targets, and risk management.

JBMA Flag N Pole Pattern.JBMA is forming a 3 day high tight flag in daily TF. Break out of the same above 1745 zone with good volumes may result in stock testing 2050/- Level. Momentum and RS is good.

JBM AUTO GETS A BREAK OUT Target 2200 SL Deeper JBM AUTO alredy moved alot but we can se 2200 in few weeks if stock correction comes we should accumulate at lower level 1750 for Target 2200

Waiting for retest of Resistance turned Support, Waiting for retest of Resistance turned Support, Waiting for retest of Resistance turned Support, Waiting for retest of Resistance turned Support, Waiting for retest of Resistance turned Support, Waiting for retest of Resistance Waiting for retest of Resistance turned Support, Waiting for retest of Resistance turned Support, Waiting for retest of Resistance turned Support, Waiting for retest of Resistance turned Support, turned Support,

JBMA - New All Time High ?Title: The Cup and Handle Pattern: A Comprehensive Guide for Traders
Introduction:
The cup and handle pattern is a popular technical analysis tool utilized by traders to identify potential trend reversals or continuations in stock prices. This distinctive pattern forms after a sustained upward movement, indicating a period of consolidation before a potential breakout. This article serves as an informative guide for traders seeking to understand and effectively apply the cup and handle pattern in their trading strategies.
Understanding the Pattern:
The cup and handle pattern consists of two main components: the cup and the handle. The cup resembles a rounded bottom, created by a gradual decline in stock prices followed by a smoother, curved rebound. The handle is a shorter consolidation period that follows the cup's formation. It usually takes the form of a small, downward-sloping channel or a brief pullback in stock prices.
Pattern Significance:
Traders consider the cup and handle pattern significant due to its potential to forecast future price movements. It suggests that after a prolonged uptrend, the stock experiences profit-taking and consolidation before resuming its upward trajectory. This pattern is particularly relevant when observed within an existing bullish trend, indicating a continuation rather than a reversal.
Identifying the Pattern:
To identify the cup and handle pattern, traders should look for the following characteristics:
1. Cup Formation: The cup component should have a smooth, rounded bottom, resembling the shape of a tea cup. The decline and subsequent recovery should be gradual, displaying an absence of sharp price drops.
2. Handle Formation: The handle typically follows the cup's formation and showcases a smaller consolidation period. This segment can appear as a slight downtrend or a horizontal trading range.
3. Volume: During the cup formation, trading volume often decreases as prices drop, signaling a decline in selling pressure. As the handle forms, volume tends to remain low but might experience a slight uptick.
Entry Points and Targets:
Traders usually enter a position when the price breaks above the handle's upper trendline, also referred to as the "neckline." This breakout is often accompanied by increased trading volume, validating the pattern's potential. The price target can be estimated by measuring the pattern's depth (cup's height) and adding it to the neckline's breakout point.
Setting Stop Loss:
To manage risk effectively, traders commonly place their stop loss orders just below the neckline. This level acts as a crucial support level; if the price retraces below the neckline after a false breakout, it could invalidate the pattern and suggest a potential trend reversal.
Conclusion:
The cup and handle pattern is a valuable tool in a trader's technical analysis arsenal, providing insights into potential price movements after a period of consolidation. While its formation requires careful observation and interpretation, the pattern's breakout above the neckline can offer rewarding trading opportunities. However, like all trading strategies, risk management through the placement of stop loss orders is essential to mitigate potential losses in case of pattern failure. As with any trading approach, combining the cup and handle pattern with other technical and fundamental analyses can enhance the overall trading strategy's effectiveness.
Note:- Not a financial advice. Only for educational purposes

#JBMAUTO#JBMAUTO
Again price is rising with rising volume
Exit - below 50 ema exit.
CMP:1311 @ 15 August 2023

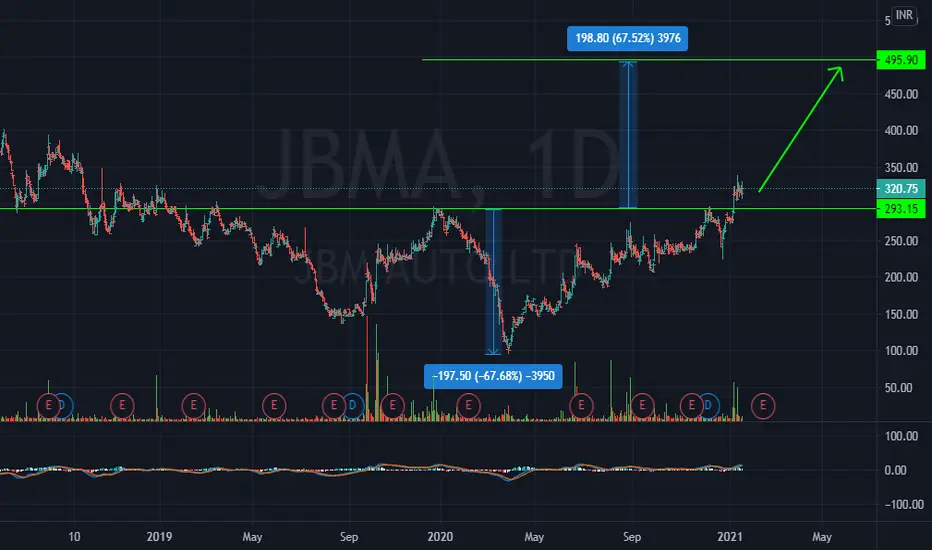
NSE : JBMA - JBM Auto for next rally for over 100%??NSE:JBMA
JBM Auto Ltd is an automotive company engaged in the manufacturing and sale of sheet metal components, tools, dies & moulds, and buses, including spare parts and maintenance contracts. 🚗💡🔧🚌
The Auto Components Segment: 🚘
Manufactures auto systems and high-level assemblies such as chassis & suspension systems, aesthetical parts, and BIW parts & assemblies. 🛠️🔩
The OEM Segment: ⚡🚌
Focuses on manufacturing technologically superior buses customized for different operating patterns. 📈
Developed and delivered electric buses, with an order book of around 1500 buses, including 200 electric ones. ⚡🚌
Tool Room Division: 🔧💼📐
Manufactures tools and dies for turnkey projects.
Major focus on safety critical items like chassis & suspension systems and key aesthetical parts.
Customer Base: 🌐🤝
Includes major OEMs like Ashok Leyland, Daimler, Nissan, Renault, Ford, Toyota, Volvo, Tata, and more.
Manufacturing Capabilities: 🏭📍🚚
15 manufacturing facilities strategically located near major OEM hubs.
Amalgamation of Subsidiaries: 💼🤝🔄
JB MA Automotive Pvt Ltd and JBM Auto Systems Pvt Ltd amalgamated with JBM Auto Ltd.
(Note: Please consult the original source for more detailed and up-to-date information)
Disc: Invested , second trance added today ,


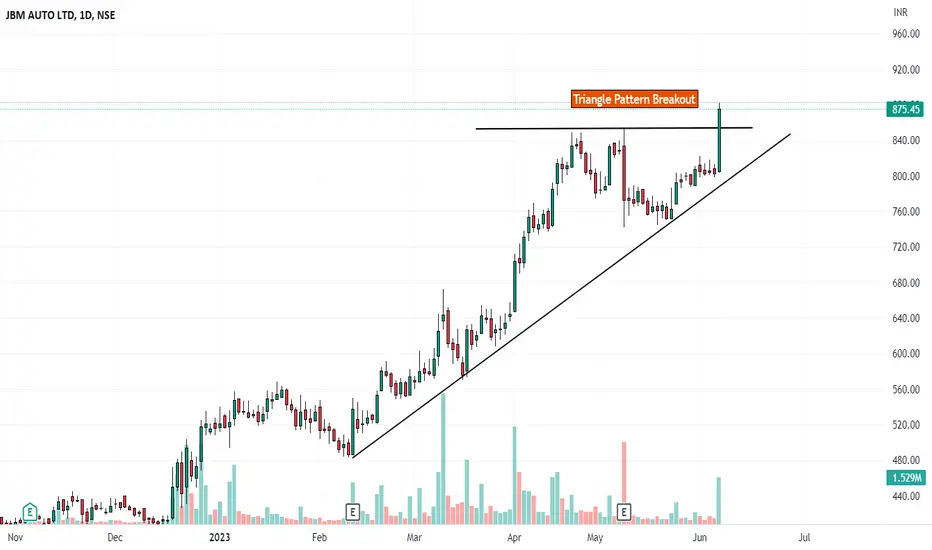
Triangle Pattern BreakoutPlease look into the chart for a detailed understanding.
Consider these for short-term & swing trades with 2% profit.
For BTST trades consider booking
target for 1% - 2%
Please consider these ideas for educational purpose
Comment below if you are looking for any answers
JBM Auto - Good setup even in falling market conditionLooks good to as stock is holding strength even in falling market

triangle pattern breakout. analyst and enter with stoplossbreakout with high volume, can move upto 10%, keep stoploss and trade

JBMA - Long viewThe price has broken out from its consolidation area and has now picked up an upward movement.
One can buy JBMA above 504 for a price target of 554 with a stop loss of 478
The views presented are of the author and is for educational purpose only.
Kindly consult your financial advisor before investing.

swing entry its hard to wait in a monthly TF setup to conclude a trade, as of now CNXAUTO is in good support and tends to move HH.

JBMA looks goodcmp 1124
buy above blue line
trgt 2% % - 5%
Disclaimer:
All information shared is just for educational purposes.
By no means shall we be accountable for any debits/losses amounting out of it.
We are not SEBI registered Analysts, so please consult your Investment Advisor and take rational decisions.

Jbm auto breakout Jbm auto breakout on daily chart time frame best buy range 480 490 target possible 500 520+++
Stoploss 466


bullishstock is weekly and daily bullish , price is rising with volumes. and price is above 200MA in weekly and daily time frame.
with sl (10%) can be taken positionally