JINDALSAW Long Term AnalysisThanks for stopping by.
All analysis here is done strictly from an investor’s perspective — focusing on risk, return, valuation, and potential upside.
The notes cover key details. I’ve backed every thesis with my own analysis — no fluff, just what matters to investors.
If you find the idea useful or have suggestions, feel free to leave a comment. Always open to fresh insights.
Kind regards,
Psycho Trader
JINDALSAW trade ideas

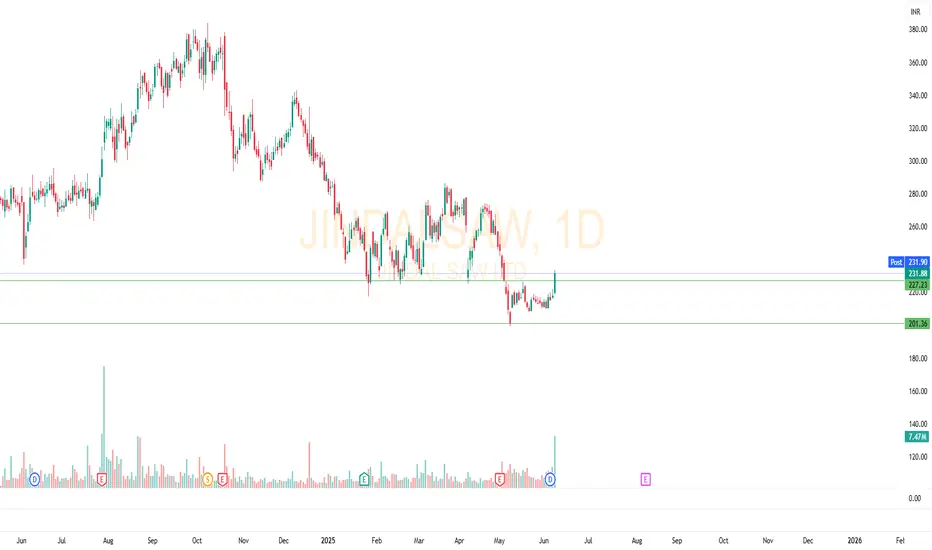
JINDAL SAW | Breakout from Base – Trend Reversal in Play?Jindal Saw Ltd has shown a strong bounce from the ₹200–₹202 support zone after multiple tests. Today’s breakout candle above ₹227 is accompanied by higher volume, indicating potential trend reversal.
🔹 Previous structure: Prolonged downtrend
🔹 Structure shift: Higher low formed, followed by a breakout
🔹 Immediate Resistance: ₹240–₹245
🔹 If sustains above ₹227, move toward ₹260–₹280 possible in coming weeks
RSI also crossed 50 mark with momentum, supporting bullish sentiment.
🔎 Trade Setup (for study only):
• Entry: ₹231.90
• SL: ₹220 (below previous swing)
• Target 1: ₹245
• Target 2: ₹260
Disclaimer:
This analysis is for educational purposes only. This is not investment advice. Please consult with a financial advisor before making any trading decisions. Always do your own research.
JINDAL SAW LTD S/R Support and Resistance Levels:
Support Levels: These are price points (green line/shade) where a downward trend may be halted due to a concentration of buying interest. Imagine them as a safety net where buyers step in, preventing further decline.
Resistance Levels: Conversely, resistance levels (red line/shade) are where upward trends might stall due to increased selling interest. They act like a ceiling where sellers come in to push prices down.
Breakouts:
Bullish Breakout: When the price moves above resistance, it often indicates strong buying interest and the potential for a continued uptrend. Traders may view this as a signal to buy or hold.
Bearish Breakout: When the price falls below support, it can signal strong selling interest and the potential for a continued downtrend. Traders might see this as a cue to sell or avoid buying.
MA Ribbon (EMA 20, EMA 50, EMA 100, EMA 200) :
Above EMA: If the stock price is above the EMA, it suggests a potential uptrend or bullish momentum.
Below EMA: If the stock price is below the EMA, it indicates a potential downtrend or bearish momentum.
Trendline: A trendline is a straight line drawn on a chart to represent the general direction of a data point set.
Uptrend Line: Drawn by connecting the lows in an upward trend. Indicates that the price is moving higher over time. Acts as a support level, where prices tend to bounce upward.
Downtrend Line: Drawn by connecting the highs in a downward trend. Indicates that the price is moving lower over time. It acts as a resistance level, where prices tend to drop.
Disclaimer:
I am not a SEBI registered. The information provided here is for learning purposes only and should not be interpreted as financial advice. Consider the broader market context and consult with a qualified financial advisor before making investment decisions.

JINDALSAW LONGJINDALSAW
RSI Above 60
Price Close Above EMA
Volume Accumulation
Buy :- 336
SL :- 308
Target :- 365 / 373

JINDAL SAW S/R Support and Resistance Levels:
Support Levels: These are price points (green line/shade) where a downward trend may be halted due to a concentration of buying interest. Imagine them as a safety net where buyers step in, preventing further decline.
Resistance Levels: Conversely, resistance levels (red line/shade) are where upward trends might stall due to increased selling interest. They act like a ceiling where sellers come in to push prices down.
Breakouts:
Bullish Breakout: When the price moves above resistance, it often indicates strong buying interest and the potential for a continued uptrend. Traders may view this as a signal to buy or hold.
Bearish Breakout: When the price falls below support, it can signal strong selling interest and the potential for a continued downtrend. Traders might see this as a cue to sell or avoid buying.
20 EMA (Exponential Moving Average):
Above 20 EMA(50 EMA): If the stock price is above the 20 EMA, it suggests a potential uptrend or bullish momentum.
Below 20 EMA: If the stock price is below the 20 EMA, it indicates a potential downtrend or bearish momentum.
Trendline: A trendline is a straight line drawn on a chart to represent the general direction of a data point set.
Uptrend Line: Drawn by connecting the lows in an upward trend. Indicates that the price is moving higher over time. Acts as a support level, where prices tend to bounce upward.
Downtrend Line: Drawn by connecting the highs in a downward trend. Indicates that the price is moving lower over time. It acts as a resistance level, where prices tend to drop.
RSI: RSI readings greater than the 70 level are overbought territory, and RSI readings lower than the 30 level are considered oversold territory.
Combining RSI with Support and Resistance:
Support Level: This is a price level where a stock tends to find buying interest, preventing it from falling further. If RSI is showing an oversold condition (below 30) and the price is near or at a strong support level, it could be a good buy signal.
Resistance Level: This is a price level where a stock tends to find selling interest, preventing it from rising further. If RSI is showing an overbought condition (above 70) and the price is near or at a strong resistance level, it could be a signal to sell or short the asset.
Disclaimer:
I am not a SEBI registered. The information provided here is for learning purposes only and should not be interpreted as financial advice. Consider the broader market context and consult with a qualified financial advisor before making investment decisions.

Jindal Saw LimitedJindal Saw Limited, Here is an Idea to go long on Jindal Saw Limited how ever trade with proper managements.

JindalSaw - Uptrend - Long term1. Bos - uptrend
2. 50% retracement & touched support level
3. ADX - shows strength of the trend
4. Taken support at Pivot
5. Day before candle formed Hammer and previous day candle break out the day before candle and closed
6. Double Bottom at support level

#JindalsawA very bullish pattern formation.
Lookout for the breakout soon
These setup are highly rewarding.

Jindal Saw Daily TFJindal Saw Ltd (Daily TF)
CMP 575
All Time high breakout and retest done
Volume Spurt
Target 700 if sustain above ATH with SL below 530
Disclaimer : For Educational purpose only
No Buy Sell recommendation

Jindalsaw : Symmetric Triangular BreakoutJindalsaw :
Symmetric Triangular breakout
Long above 552 with support at 543

Buy Jindal Saw🚀 Add/Buy Jindal Saw at the current price (~442) 🔍
💡 Stoploss set at 405 ⛔
🎯 Target set at 570 🚀
📉 Boasting an extremely cheap PE of 11.36! 💰 #StockMarket #jindal #elliotwave #jindalsaw #trading

Jindal SawStock has given a breakout of channel pattern. One can add this stock in your watchlist and trade as per your analysis as this chart is not a buy/sell recommendation

JINDALSAW NEAR BREAKOUTJindalsaw looking very bullish , can give 25-30% returns in near term if sustains above 391 and keep your stoploss at 380 on closing basis
STOCK FUNDAMENTALS-
PE 13
MKTCAP 12186Cr
DE 0.62
ROE 7.99%

JINDALSAW 13.28% UPSIDE POTENTIALBreakout of double bottom pattern has been done on JINDALSAW and what I'm looking for is the retest to take it to the upside.
Target - 400

OPPORTUNITY BREAKOUT Grt opportunity but remember sl
Hold untill 1:3
Volume confirmation
Exponential average breakout
Rs increase

JINDAL SAWa small demo video of my work know as techno funda in which we find a stocks with technicals and fundamentals ,but most important thing in market is sustainability ,which is only possible by proper risk management

JINDALSAW SYMMETRICAL TRIANGLE BREAKOUTSymmetrical Triangle pattern breakout in Jindalsaw now it's in control of bulls.
TP1 - 358.75
TP2 - 373.90
TP3 - 380

Jindal Saw Ltd.*Jindal Saw Ltd.*
C&H Pattern: Yearly Basis
Strong Vol. Consolidation / Continued BuiltUp
Multiyear Price Trendline: BreakOut
With Upside, Trail SL
Book Profit as per Risk Appetite
Snapshot
Estab: ’84 (PR Jindal Group Co). Mfgs. LSAW, HSAW, DI, Seamless pipes & pellets.
6 Plants in India. Captive Iron-ore Mine (Bhilwara)/180 MMT/6-7MTPA production.
Sale: Domestic/Exports=82:18 (FY22)
Sales / Profitability: Improving (Jun’22 an Aberration)
RoA/RoE/RoCE: Stable /Improving
Moderate Leverage, Stable TNW. +ve CF from Ops. C&CE of Rs.220 Crs (Sep’22)
Order book of $974 Mn (Aug’22). Healthy Cash Accruals from Ops.
Concern:
High Investment / Loans & Advances in Subs.
High Contingent liabilities of ~Rs.1633 Crs (FY22)
Protracted litigation bw JITF (Sub) & NTPC.
Stretched WC Cycle.
Do Your Own Research as Well. This is Just an Opinion.
Happy Investing :)

Jindal saw towards Target of 215After weekly breakout stock goes approx same point from bottom to breakout.

JINDALSAW formed cup & handleCMP 142 | New 52 Week High | Good quarterly growth in the recent results | High volume gain | Bullish indicators | Increasing Revenue every quarter for the past 2 quarters
Iron & Steel
Product line of the company includes Large Diameter Pipes, Line Pipes, Ductile Iron (DI) Pipes, seamless tubes etc
*Not recommendation

JINDALSAW SWINGNSE:JINDALSAW
Script - JINDALSAW
CMP - 125
Target - 190
TF - Monthly
if any doubt please ask.
keep support me.
For educational purpose only.
i am not sebi registered.
Do your own analysis.
Please consult your financial advisor.


JINDALSAW stock good for future investment??as per my analysis jindal saw in clear doublebottom for fly. it is slow trend stock but good technically .180 is my analysis target ..
