Jindal SteelAnother strong candidate from the metal sector. Huge consolidation and VCP in ratio charts show that it can be good candidate provided metal sector start working
JINDALSTEL trade ideas

JINDALSTELNSE:JINDALSTEL
Note :
1. One should go long with a Stop Loss, below the Trendline or the Previous Swing Low.
2. Risk :Reward ratio should be minimum 1:2.
3. Plan your trade as per the Money Management and Risk Appetite.
Disclaimer :
>You are responsible for your profits and loss.
>The idea shared here is purely for Educational purpose.
>Follow back, for more ideas and their notifications on your email.
>Support and Like incase the idea works for you.

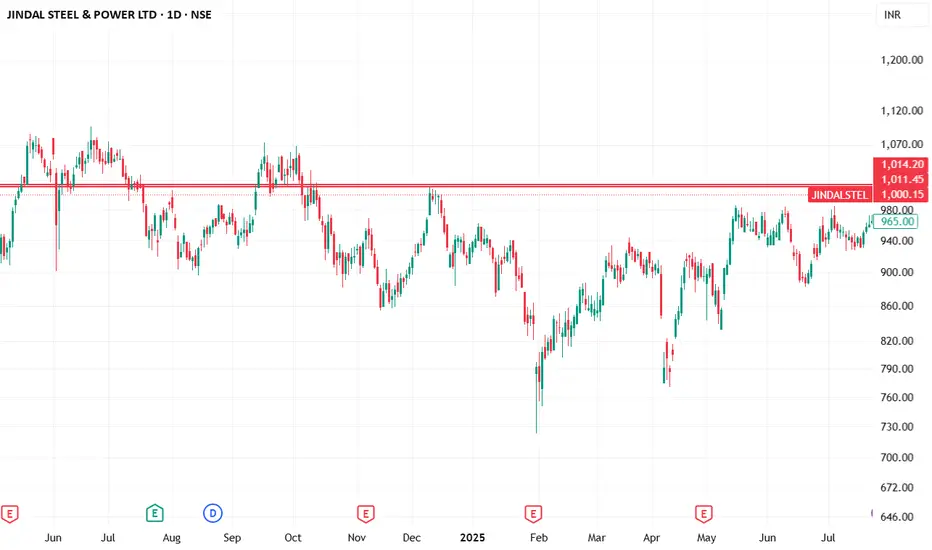
Jindalstel Bullish above 1012..Jindalstel looking bullish if breaks decisively 1012 levels
last resistance levels is 1012 is breaks can get good upside move
let's c how it reacts
it will change its character also
JINDAL STEEL: Leading Diagonal Starting?JINDAL STEEL & POWER appears to be constructing an initial impulsive advance that may very well be taking the form of a Leading Diagonal. The advance from the 770 lows has so far developed into a structure where Wave 4 has overlapped with Wave 1 territory, suggesting that a classical impulse structure may not be applicable here. Instead, the price action fits neatly within the characteristics of a leading diagonal pattern, which allows such overlaps.
Wave 1 terminated at 923.80 followed by a corrective pullback into Wave 2 at 833.60. The subsequent rise into Wave 3 reached 985.80, which completed near the 100% extension of Wave 1, supporting the diagonal scenario where extensions are often limited. This was followed by a clear a-b-c correction into Wave 4, which found support at 882.65. Notably, the c-leg of Wave 4 reached close to 1.618 times the length of Wave a, adding further symmetry to this structure.
The current advance may therefore represent Wave 5 of this diagonal, projecting towards the 1036 to 1131 region of Fibonacci extensions. However, since leading diagonals typically signal the start of a larger structure, this entire formation could well be unfolding as either the first leg of a higher degree impulse (Wave 1) or as an initial Wave A of a larger correction. The labeling is thus kept open as "1/a" to reflect both possibilities at this stage.
The invalidation level for the current bullish scenario remains at 882.65, below which this entire leading diagonal interpretation would require reassessment. Until then, the bias remains upwards as the final leg of this structure seeks completion.
Disclaimer: This analysis is for educational purposes only and does not constitute investment advice. Please do your own research (DYOR) before making any trading decisions.


Jindal Steel & Power ,1DPattern is looking very very good , enter into trade after upper trendline is fully broken with Good Volume with strong candle .
Take Risk According to your Capital
Follow for more Swing Ideas Like this .

Jindal Steel - Long Set-UPNSE:JINDALSTEL
This weekly chart of Jindal Steel & Power Ltd (NSE: JINDALSTEL) shows a breakout from a long-term symmetrical triangle pattern, which had formed after a strong prior uptrend—indicating potential continuation of bullish momentum. The breakout is supported by a rising 20-week EMA and volume expansion, suggesting institutional interest. The green zone marks a key demand area, previously acting as both resistance and support, which has been reclaimed. Sustained price action above ₹950 could open up upside targets towards ₹1,100–₹1,250, while ₹900 remains a critical support zone for invalidation


Jindal Steel- Time to move?!
Buy Above 895.3
Risk: Reward- 01:01
Target and stop Loss: 4%
1.Parallel downward channel Resistance breakout and retest
2.Good green bars formation
3.Double bottom( W Pattern) and resistance in RSI
4. 21 EMA Support taken
5.Bullish fair value gap rejection
6. Bounced from Resistance turned to support zone

jindal steelIndia's Directorate General of Trade Remedies (DGTR) has initiated a safeguard investigation concerning imports of non-alloy and alloy steel flat products. This action typically arises when there is concern that increased imports of a particular product are causing or threatening to cause serious injury to domestic producers in that sector.
In this context, "non-alloy and alloy steel flat products" refer to a category of steel products that are flat in shape and can be either non-alloy (made from iron and carbon, without significant amounts of other elements) or alloy (containing additional elements that enhance certain properties).
The safeguard probe will assess whether the surge in imports is indeed causing harm to local manufacturers. If the investigation finds a significant negative impact on domestic producers, the DGTR may recommend protective measures, such as tariffs or quotas, to help stabilize the domestic market and preserve jobs within the industry.
This move is part of a broader strategy to protect local industries from unfair competition and ensure sustainable growth


JINDALSTEL Daily timeframe analysis for long
NSE:JINDALSTEL has bounced back from major support zone with narrow inside range breakout.
Can add more till 886 only with SL 870.
Major Targets Highlighted in Blue lines, sub targets in grey lines.

Jindal Steel & Power Ltd: A Comprehensive Stock ReviewJINDALSTEL
Jindal Steel & Power Ltd is a significant player in the Indian steel and energy sector. With a market capitalization of ₹1,02,606 crore, the company has shown steady growth over the years, making it a stock worth monitoring.
Key Financial Indicators
Let’s take a closer look at the core financial metrics:
Market Cap: ₹1,02,606 Cr.
Current Price: ₹1,006
52-Week High/Low: ₹1,097 / ₹582
Stock P/E: 18.4 – Indicates that the stock is priced at 18.4 times its earnings.
Book Value: ₹434 – This represents the company's net asset value per share.
Dividend Yield: 0.20% – A modest return for income-seeking investors.
ROCE (Return on Capital Employed): 13.2% – Measures how efficiently the company is generating profit from its capital.
ROE (Return on Equity): 14.1% – Indicates the profitability relative to shareholders’ equity.
Promoter Holding: 61.2% – Strong promoter interest, with a slight increase of 0.74% in the last 3 years.
Pledged Percentage: 13% – A part of promoter's holding is pledged.
Technical Analysis Overview
From a technical standpoint, Jindal Steel & Power Ltd is showing promising levels for those tracking its price movements.
Current Level: Rs. 1,006
Potential Upside: Watch for movements above the ₹1,015 range. This level could indicate further momentum.
On the downside, the stock may revisit:
₹902
₹577
₹304
These levels offer potential opportunities for strategic entry points based on individual preferences.
Potential Targets for Swing Trading
If the stock breaks key levels, potential targets to watch include:
First Target: ₹1,413
Second Target: ₹1,726
Third Target: ₹1,943
Extended Target: ₹2,236++
These target levels make Jindal Steel & Power Ltd an interesting candidate for swing trading.
While Jindal Steel & Power Ltd presents a solid case with favorable financials and technical signals, investors should conduct their own research before making any decisions. Given the company's strong promoter backing and reasonable P/E ratio, it could appeal to both long-term investors and swing traders.
Disclaimer: We are not SEBI-registered advisors. The information provided is for educational purposes only, and readers should take care when using it for any investment decisions.

Jindal Steel and Power Ltd view for Intraday 3rd October #JINDALJindal Steel and Power Ltd view for Intraday 3rd October #JINDALSTEL
Buying may witness above 1043
Support area 1035. Below ignoring buying momentum for intraday
Selling may witness below 1025
Resistance area 1035
Above ignoring selling momentum for intraday
Charts for Educational purposes only.
Please follow strict stop loss and risk reward if you follow the level.
Thanks,
V Trade Point


From Correction to Impulse: Elliott Waves in Jindal Steel power Technical Analysis of JINDAL STEEL & POWER LTD. based on Elliott Wave Principles
This analysis uses Elliott Wave Theory and structures, offering one potential market scenario among multiple possibilities. The information is for Educational purposes only and should not be taken as trading advice . There is always a risk of being incorrect, and users should not make trading or investment decisions based solely on this analysis. The content does not guarantee profits, and we are not responsible for any financial outcomes. It is recommended to consult a financial advisor before making any trading or investment decisions.
Introduction to Elliott Wave Theory:
Elliott Wave Theory, developed by Ralph Nelson Elliott, identifies repetitive price patterns in financial markets, driven by investor psychology and crowd behavior. Here are some key Elliott Wave rules:
1. Wave 2 cannot retrace more than 100% of Wave 1.
2. Wave 3 is often the most powerful and cannot be the shortest of the impulse waves.
3. Wave 4 should not overlap with the price territory of Wave 1 (except in diagonal patterns).
4. Impulse waves move in five smaller waves (1-2-3-4-5), while corrective waves move in three waves (A-B-C).
Wave Counts and Analysis:
On the 2-hour chart of JINDAL STEEL & POWER LTD., the completion of Wave (4) in blue is likely at the 896 low. This corrective phase may have concluded, signaling the start of a new bullish impulse wave.
Current Structure: Wave (5) in Blue Unfolding
We may now be at the start of Wave (5) in blue, which suggests further upward momentum. Within this wave, the internal structure shows:
- Wave 1 in red of Wave (5) has been completed.
- Wave 2 in red of Wave (5) also seems to have finished, a typical pullback phase.
- Wave 3 in red of Wave (5) appears to be starting, signaling a potential strong upward move.
Characteristics of Wave 3:
Wave 3 is typically the most extended and powerful part of an impulse wave. It often accelerates rapidly, fueled by market sentiment, and can deliver outsized price gains. This wave is expected to push the stock price higher with more conviction.
Based on Fibonacci levels, potential targets for Wave 3 are:
- The first target could be 1020 (100% Fibonacci extension).
- A further target lies at 1076, the 1.618 Fibonacci extension, a common level for extended third waves.
- An extended target is 1111 at the 2.0 Fibonacci extension.
Moving Averages Confirmation:
Adding to the bullish outlook, JINDAL STEEL & POWER LTD. is currently trading above both the 200-period EMA and the 50-period EMA on the 2-hour, daily, and weekly timeframes, which signals strong strength to show upward momentum across multiple timeframes. The alignment of these exponential moving averages (EMAs) indicates that the stock is maintaining long-term support, which provides additional strength to the current bullish wave count.
Critical Level to Watch: 988
Once the price closes above the 988 level, we can expect further confirmation of strength. This price level is crucial as it would signal a breakout, paving the way for additional bullish momentum and targeting higher Fibonacci levels, such as 1020, 1076, and 1111.
Invalidation Level:
The wave count remains valid as long as the price stays above 896, the low of Wave (4) in blue. A break below this level would invalidate the current wave structure, implying that the bullish trend may be in jeopardy.
Summary:
In conclusion, JINDAL STEEL & POWER LTD. appears to have completed its corrective Wave (4) in blue, with the price now starting to unfold into Wave (5) in blue. With Wave 1 and Wave 2 in red complete, the stock is likely entering Wave 3 in red, which typically exhibits strong price advances. The stock’s upward trajectory is supported by its position above the 200-period EMA and 50-period EMA across multiple timeframes (2-hour, daily, weekly), further strengthening the bullish case. Key levels to watch include 1020, 1076, and 1111, while 988 acts as a near-term breakout level. The invalidation point for this wave count remains at 896.
I am not Sebi registered analyst.
My studies are for educational purpose only.
Please Consult your financial advisor before trading or investing.
I am not responsible for any kinds of your profits and your losses.
Most investors treat trading as a hobby because they have a full-time job doing something else.
However, If you treat trading like a business, it will pay you like a business.
If you treat like a hobby, hobbies don't pay, they cost you...!
Hope this post is helpful to community
Thanks
RK💕
Disclaimer and Risk Warning.
The analysis and discussion provided on in.tradingview.com is intended for educational purposes only and should not be relied upon for trading decisions. RK_Charts is not an investment adviser and the information provided here should not be taken as professional investment advice. Before buying or selling any investments, securities, or precious metals, it is recommended that you conduct your own due diligence. RK_Charts does not share in your profits and will not take responsibility for any losses you may incur. So Please Consult your financial advisor before trading or investing.

JindalstelJindal steel Ltd
CMP 953
Stock is moving in a channel. If it breakouts then waait for retracement for entry
Failed to breakout it will move in channel.

Jindal Steel BuyJindal Steel can be bought in this zone foe a target of near all time high soon..
buy 920-935
Keep stop loss 900 around
Target 1030 1100

Jindal Stel & Power Ltd view for Intraday 3rd September #JINDALSJindal Stel & Power Ltd view for Intraday 3rd September #JINDALSTEL
Buying may witness above 972
Support area 958-960.. Below ignoring buying momentum for intraday
Selling may witness below 958
Resistance area 970-972
Above ignoring selling momentum for intraday
Charts for Educational purposes only.
Please follow strict stop loss and risk reward if you follow the level.
Thanks,
V Trade Point

Jindal Steel Long Target 1100Jindal Steel share elliot wave analysis daily time complete Extend flat correction . Extend flat correction Internal Wave A,B or C . Wave C internal 1,2,3,4 or 5 . Wave C Downside impulse wave . Use 2 or 4 Trend line confrim Wave C end .

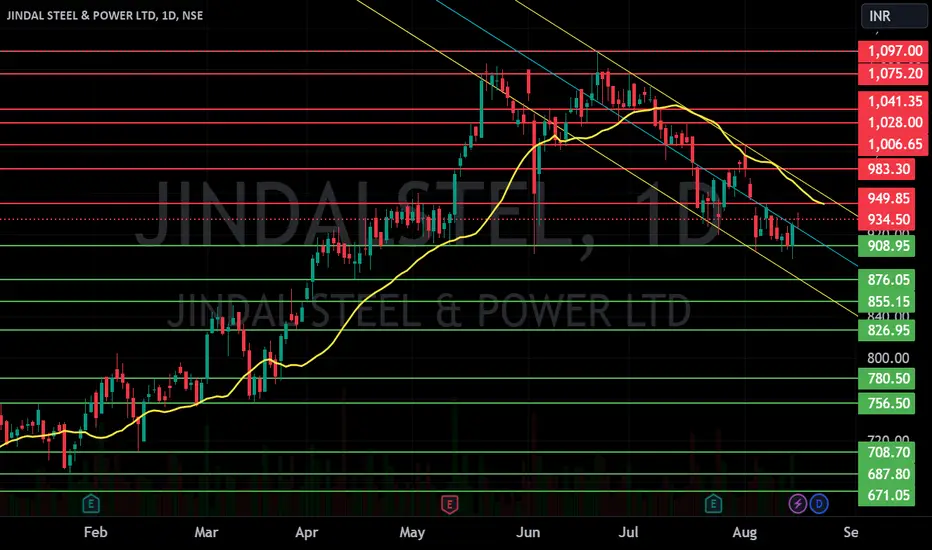
JINDAL STEEP S/RSupport and Resistance Levels:
Support Levels: These are price points (green line/share) where a downward trend may be halted due to a concentration of buying interest. Imagine them as a safety net where buyers step in, preventing further decline.
Resistance Levels: Conversely, resistance levels (red line/shade) are where upward trends might stall due to increased selling interest. They act like a ceiling where sellers come in to push prices down.
Breakouts:
Bullish Breakout: When the price moves above resistance, it often indicates strong buying interest and the potential for a continued uptrend. Traders may view this as a signal to buy or hold.
Bearish Breakout: When the price falls below support, it can signal strong selling interest and the potential for a continued downtrend. Traders might see this as a cue to sell or avoid buying.
20 EMA (Exponential Moving Average):
Above 20 EMA: If the stock price is above the 20 EMA, it suggests a potential uptrend or bullish momentum.
Below 20 EMA: If the stock price is below the 20 EMA, it indicates a potential downtrend or bearish momentum.
Trendline: A trendline is a straight line drawn on a chart to represent the general direction of a data point set.
Uptrend Line: Drawn by connecting the lows in an upward trend. Indicates that the price is moving higher over time. Acts as a support level, where prices tend to bounce upward.
Downtrend Line: Drawn by connecting the highs in a downward trend. Indicates that the price is moving lower over time. It acts as a resistance level, where prices tend to drop.
Disclaimer:
I am not a SEBI registered. The information provided here is for learning purposes only and should not be interpreted as financial advice. Consider the broader market context and consult with a qualified financial advisor before making investment decisions.
Jindal steel longthis stock complete 3 hour chart wave A,B or C downside . this correction name normal flat correction

$jindalstelthesis
country needs steel for growth so got some of this already but looking to add more closer to the white line
