74.50 INR
2.16 B INR
8.28 B INR
5.20 M
About JINDAL DRILLING IND. LTD
Sector
Industry
CEO
Narayan Ramaswamy
Website
Headquarters
Gurgaon
Founded
1983
ISIN
INE742C01031
FIGI
BBG000CTSV85
Jindal Drilling & Industries Ltd. engages in the provision of services to entities involved in exploration of oil and gas. It specializes in offshore drilling, horizontal and directional drilling, and mud logging services. The company was incorporated on October 17, 1983 and is headquartered in Gurgaon, India.
Related stocks
Jindal Drilling On DTFStock is in uptrend. Monthly Rsi shows buyers are in control. Stock hold upper levels for decent time and making news highs at this market correction .. when majoriy of stocks beaten down by also 40 to 50% this holds All time high with conviction.
Risk to rewards holds good equation to buy his sc

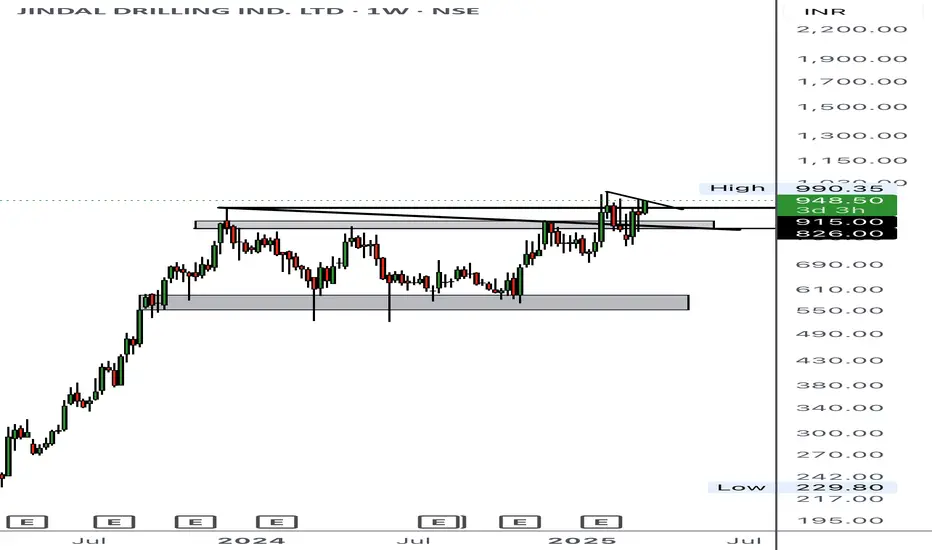
#JIndal drilling #stockinnews#Jindal Drillig, impressive results, continuous improvement in Revenue and EBITDA on QoQ and YoY. On Technical chart, Stock made a high of 834 in April-2024, after that stock was continuously falling, but took the support and now near support zone, stock is in short term trend reversal. CMP 601, T

Jindal Drilling Ltd *Jindal Drilling Ltd*
C&H; Formation on Decadal Basis.
Strong Price BreakOut & Sustained.
Vol. Consolidation gaining Traction.
RSI: 1HW<M. All in Bullish Zone.
EMAs: Widening Gaps amongst 20 /50 /100 /200 levels.
*Trail SL with Upside*
*Book Profit as per Risk Appetite*
*Do Your Own Research as

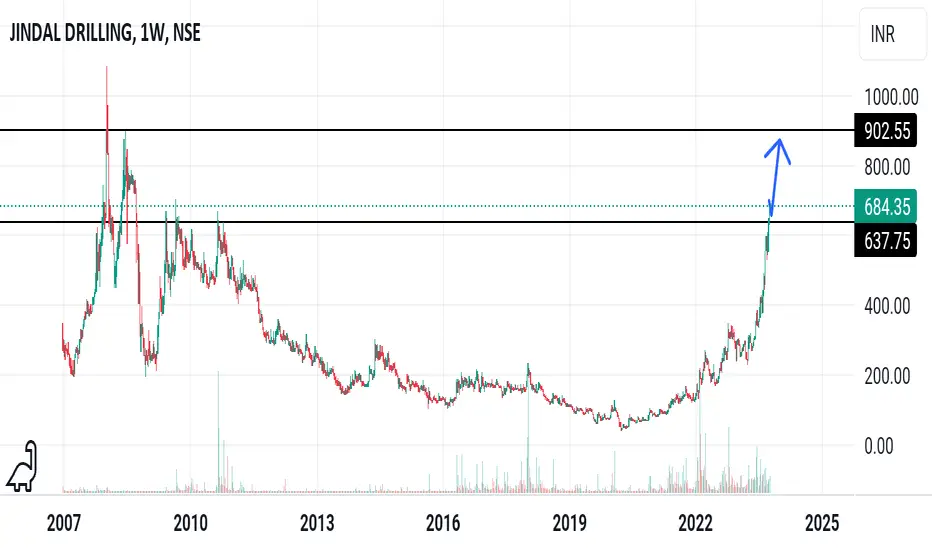
JINDAL DRILLING LONG 15 year breakout.. 2008-2023... expecting it to retest 595 may or may not happen.stock looks bullish.. #DYOR

looking good bullish excellent fundamentalbuy for long-term purposes excellent fundamental cmp 212 slcb 204 target 242 255 270++++

JINDRILLNSE:JINDRILL
Reverse and making base
Making Doji on daily basis
Rsi > 55
Moving Avg- Buy
SL - 695
SUPPORT- 737
Target- 850++

JINDRILLMomentum Stock with a orderly pullback, Ready to resume upward momentum. The stock was showing positive momentum for the last six months. One of the top 20 Momentum stocks.

JINDRILLThese are swing idea's which you can add your watchlist and analysis for yourself.
Keep on radar.
This content for only education purpose!
I am not SEBI Register.
Resistance BreakoutPlease look into the chart for a detailed understanding.
Consider these for short-term & swing trades with 2% profit.
For BTST trades consider booking
target for 1% - 2%
For long-term trades look out for resistance drawn above closing.
Please consider these ideas for educational purpose

See all ideas
Summarizing what the indicators are suggesting.
Oscillators
Neutral
SellBuy
Strong sellStrong buy
Strong sellSellNeutralBuyStrong buy
Oscillators
Neutral
SellBuy
Strong sellStrong buy
Strong sellSellNeutralBuyStrong buy
Summary
Neutral
SellBuy
Strong sellStrong buy
Strong sellSellNeutralBuyStrong buy
Summary
Neutral
SellBuy
Strong sellStrong buy
Strong sellSellNeutralBuyStrong buy
Summary
Neutral
SellBuy
Strong sellStrong buy
Strong sellSellNeutralBuyStrong buy
Moving Averages
Neutral
SellBuy
Strong sellStrong buy
Strong sellSellNeutralBuyStrong buy
Moving Averages
Neutral
SellBuy
Strong sellStrong buy
Strong sellSellNeutralBuyStrong buy
Displays a symbol's price movements over previous years to identify recurring trends.
Frequently Asked Questions
The current price of JINDRILL is 646.55 INR — it has increased by 1.61% in the past 24 hours. Watch JINDAL DRILLING IND. LTD stock price performance more closely on the chart.
Depending on the exchange, the stock ticker may vary. For instance, on NSE exchange JINDAL DRILLING IND. LTD stocks are traded under the ticker JINDRILL.
JINDRILL stock has risen by 1.36% compared to the previous week, the month change is a 1.13% rise, over the last year JINDAL DRILLING IND. LTD has showed a −6.13% decrease.
JINDRILL reached its all-time high on Jan 7, 2008 with the price of 1,085.05 INR, and its all-time low was 40.55 INR and was reached on Mar 24, 2020. View more price dynamics on JINDRILL chart.
See other stocks reaching their highest and lowest prices.
See other stocks reaching their highest and lowest prices.
JINDRILL stock is 5.91% volatile and has beta coefficient of 1.17. Track JINDAL DRILLING IND. LTD stock price on the chart and check out the list of the most volatile stocks — is JINDAL DRILLING IND. LTD there?
Today JINDAL DRILLING IND. LTD has the market capitalization of 18.47 B, it has increased by 1.43% over the last week.
Yes, you can track JINDAL DRILLING IND. LTD financials in yearly and quarterly reports right on TradingView.
JINDRILL net income for the last quarter is 716.10 M INR, while the quarter before that showed 659.50 M INR of net income which accounts for 8.58% change. Track more JINDAL DRILLING IND. LTD financial stats to get the full picture.
Yes, JINDRILL dividends are paid annually. The last dividend per share was 0.50 INR. As of today, Dividend Yield (TTM)% is 0.08%. Tracking JINDAL DRILLING IND. LTD dividends might help you take more informed decisions.
EBITDA measures a company's operating performance, its growth signifies an improvement in the efficiency of a company. JINDAL DRILLING IND. LTD EBITDA is 2.37 B INR, and current EBITDA margin is 28.68%. See more stats in JINDAL DRILLING IND. LTD financial statements.
Like other stocks, JINDRILL shares are traded on stock exchanges, e.g. Nasdaq, Nyse, Euronext, and the easiest way to buy them is through an online stock broker. To do this, you need to open an account and follow a broker's procedures, then start trading. You can trade JINDAL DRILLING IND. LTD stock right from TradingView charts — choose your broker and connect to your account.
Investing in stocks requires a comprehensive research: you should carefully study all the available data, e.g. company's financials, related news, and its technical analysis. So JINDAL DRILLING IND. LTD technincal analysis shows the buy rating today, and its 1 week rating is sell. Since market conditions are prone to changes, it's worth looking a bit further into the future — according to the 1 month rating JINDAL DRILLING IND. LTD stock shows the buy signal. See more of JINDAL DRILLING IND. LTD technicals for a more comprehensive analysis.
If you're still not sure, try looking for inspiration in our curated watchlists.
If you're still not sure, try looking for inspiration in our curated watchlists.