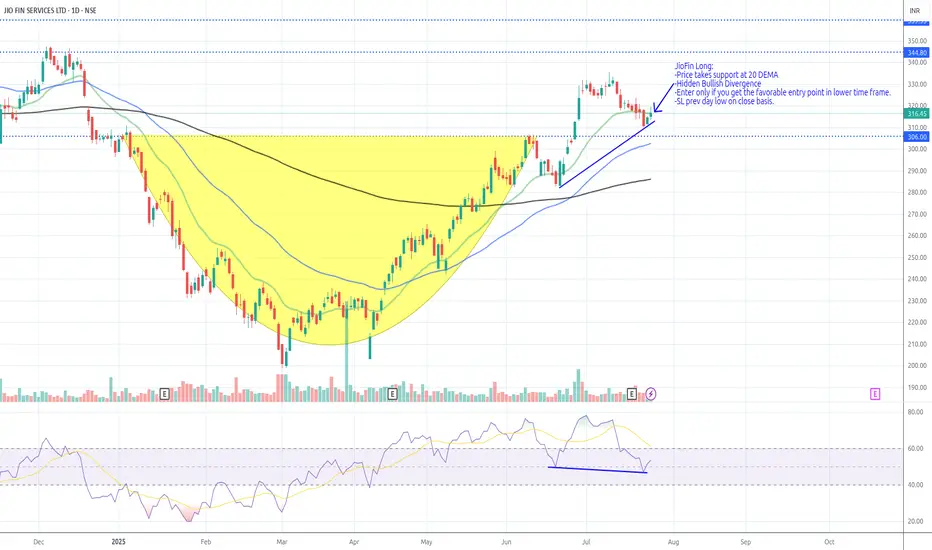
JioFin Long_Support @ 20 DEMAJioFin Long:
-Price takes support at 20 DEMA
-Hidden Bullish Divergence
-Enter only if you get the favorable entry point in lower time frame.
-SL prev day low on close basis.
JIOFIN trade ideas
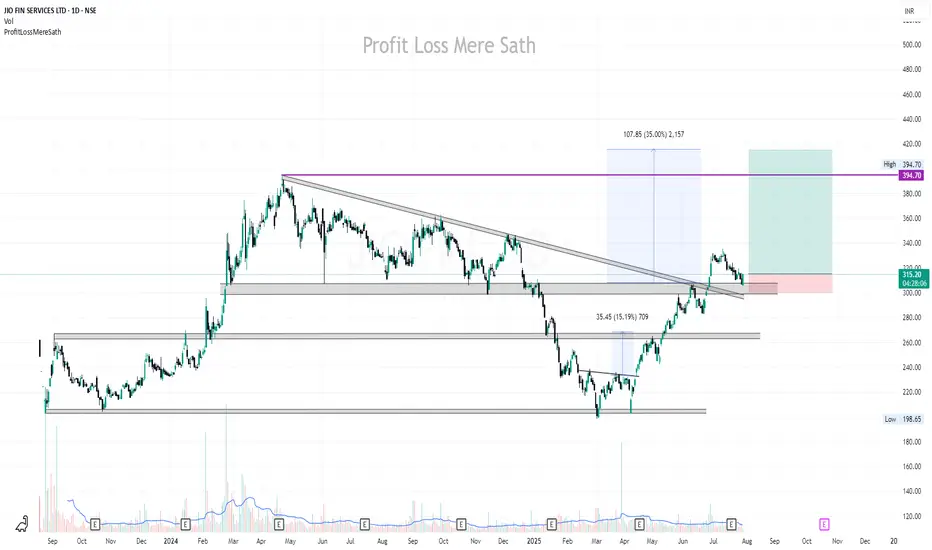
JIOFIN | Buy @315 | Strict SL below 300 | Target 400Disclaimer:
This is not financial advice. Please do your own research or consult with a financial advisor before making any investment decisions. Investments in stocks can be risky and may result in loss of capital.
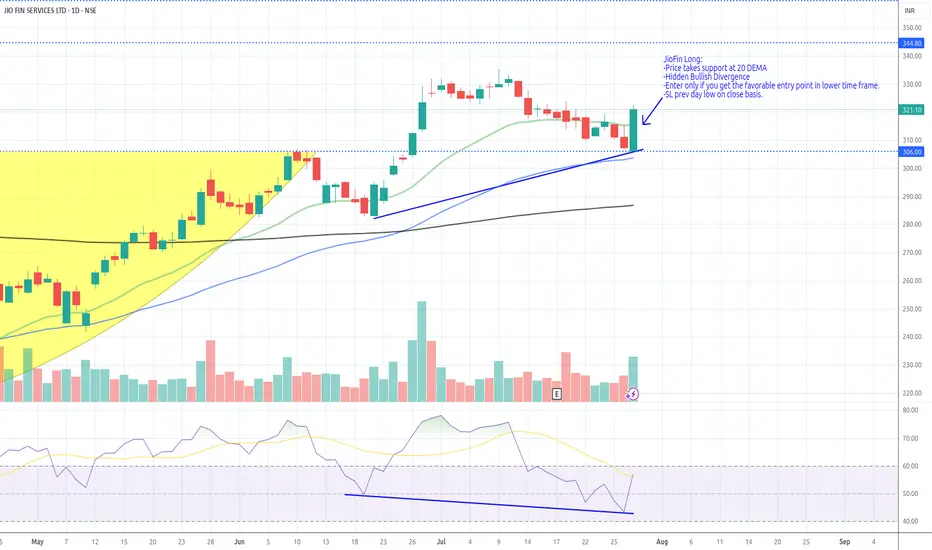
JioFin Long_Support @ 20 DEMAJioFin Long:
-Price takes support at 20 DEMA
-Hidden Bullish Divergence
-Enter only if you get the favorable entry point in lower time frame.
-SL prev day low on close basis.
JIO FIN technical ideaHi there,
Hope you're doing great.
JIO Fin is looking good for long term, it's time to buy some more quantity for upcoming weeks.
Breakout is done and currently it's in retesting phase.
This is only for educational purpose.
: Pls consult your financial advisor before investing.
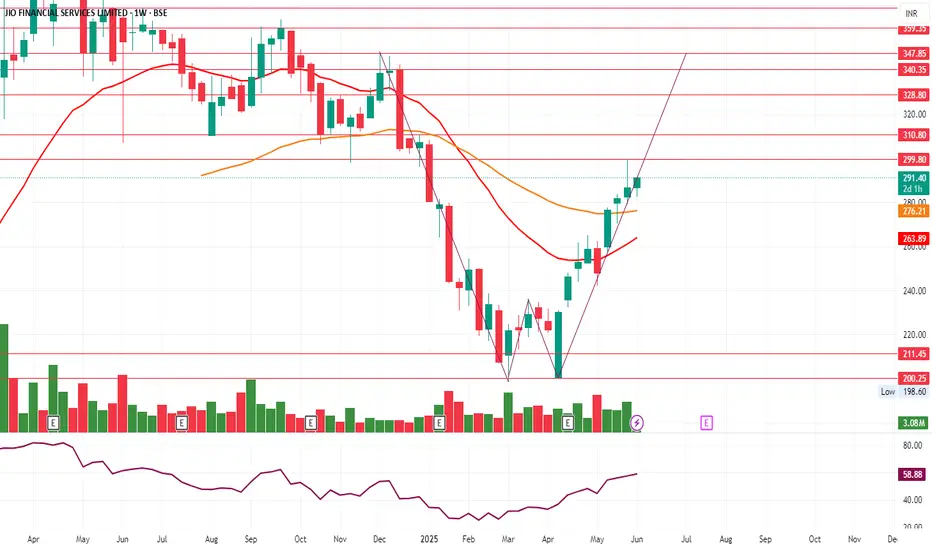
Ye chart Kuch Kehta Hai - Jio Financial Jio Financial Services stock shows strong potential for growth on the weekly technical chart based on multiple technical indicators and moving averages signaling bullish momentum:
Strong Buy Signals Across Moving Averages: All key moving averages (5, 10, 20, 50, 100, and 200-day SMAs and EMAs) are indicating a "Buy" or "Strong Buy" signal, reflecting sustained upward price momentum over various time frames.
Bullish Technical Indicators: Indicators such as MACD, ADX, CCI, ROC, and Ultimate Oscillator are all showing buy signals, supporting a positive trend continuation. For example, MACD is positive and rising, ADX at 46.6 indicates a strong trend, and CCI at 177.7 confirms bullish momentum.
Overbought but Strong Momentum: Although the RSI (14) is overbought at 81.3, which typically signals caution, in strong trending markets this can indicate continued strength rather than an immediate reversal.
Price Action and Pivot Levels: The stock price is currently above key pivot points and resistance levels, with classic pivot resistance around 329-335 levels, suggesting room for further upward movement before significant resistance is encountered.
Recent Price Performance: Jio Financial has gained nearly 10% in the past week and over 11% in the last month, demonstrating strong recent buying interest and momentum.
Volatility and Volume Support: The ATR (Average True Range) indicates high volatility, which can fuel strong price moves, and the Bull/Bear Power indicator confirms buyers' dominance.
In summary, the weekly technical chart for Jio Financial Services reflects a robust bullish setup with multiple moving averages and momentum indicators aligned on the buy side, supported by recent strong price gains and favorable pivot levels. This technical landscape suggests a high probability of continued price appreciation in the near term on the weekly timeframe

Jio Financials Inverse Head & ShoulderThere is a developing pattern on the charts of Jio Financials.
The levels are marked clearly.
This is to spread awareness and pass my technical analysis learnings.
Conduct your own research before taking any financial decision.

Weekly supply As it is a weekly supply zone it may achieve the target in a month but sticy stop loss is compulsory

JIOFIN - The real test.As always, the chart is self-explanatory.
- The price is at a dual resistance point: previous support turned resistance and trendline resistance.
- Crossing this point will be crucial if the price needs to maintain its upward momentum.
Do you think Jio can do it in the first go?
Disclaimer: The information provided in this post is for educational and informational purposes only and should not be considered as financial advice. I am not a licensed financial advisor, and this content is based on my personal analysis and opinions. Trading stocks involves significant risk, and you should conduct your own research or consult with a qualified financial advisor before making any investment decisions. Past performance is not indicative of future results. I am not responsible for any financial losses or gains you may incur as a result of using the information provided herein.


Positional Setup for Jio Financial Services Ltd (NSE)CMP: ₹300.80
Immediate Resistance: ₹306
Support Levels: ₹277 / ₹267 / ₹254
Structure: Rounded bottom breakout in progress after a prolonged downtrend recovery
Momentum Indicator: RSI near breakout confirmation, strength building
📈 Technical View (Positional)
Price is retesting key resistance at ₹306 — a breakout above this level may unlock a fresh upside rally.
Increasing volumes and bullish recovery from lows (~₹215) suggest accumulation.
Close above ₹306 (preferably with volume) will confirm the rounded bottom breakout.
🚀 Positional Levels:
Entry Range: ₹295–₹305 (on closing confirmation)
Target 1: ₹330
Target 2: ₹358
Target 3: ₹390
Stop-Loss (Closing Basis): ₹277

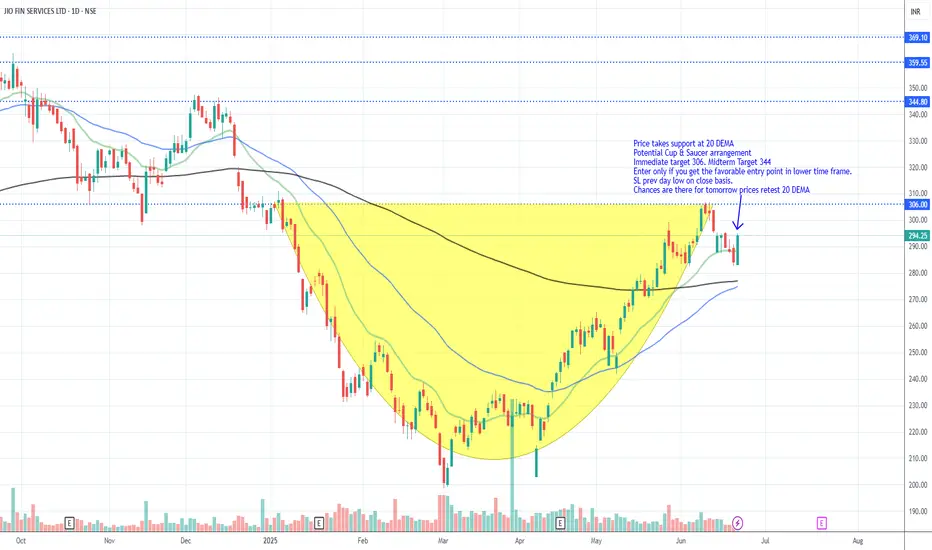
JIOFIN_Long_Wait for EntryPrice takes support at 20 DEMA
Potential Cup & Saucer arrangement
Immediate target 306. Midterm Target 344
Enter only if you get the favorable entry point in lower time frame.
SL prev day low on close basis.
Chances are there for tomorrow prices retest 20 DEMA
JIO Finance : Recovered well from the support now at resistance JIO Finance : Recovered quite well from the support of 200 now sitting at a Major Resistance.
( Not a Buy / Sell Recommendation
Do your own due diligence ,Market is subject to risks, This is my own view and for learning only .)

Jio Financial Services Ltd.*Jio Financial Services Ltd.*
*W* formation on Weekly basis.
Strong Volume Traction .
RSI: 1H=D >W>M. All in Bullish zone.
EMAs: Golden Cross on Weekly Basis.
Respective Resistance levels are likely Targets.
*Trail SL with Upside*
*Book Profit as per Risk Appetite*
*This is an Opinion. Do your own research as well.*
*_Happy Investing_*🤓
Momentum Trade in Jio Fin1. Cup and Handle breakout
2. Volume pop up
3. MACD signal turning green
4. RSI above 50
5. Good risk to reward


next breakout on jio fin-most probably jio fin will break this range and will see up side on upcoming days

JIOFINJIOFIN
watch above levels. green line is our entry, redline is our SL.
DISCLAIMER : I am NOT a SEBI registered advisor or a financial adviser. All the views are for educational purpose only.

GANNSQ9 + LRC + FIBO RETRACEMENTThe price has broken the upper line of the linear regregreesion lines in this chart. It indicates potential reversal of trend. The fibonacci retracement line dram from 394.70 to 198.55 shows important levels for the bulls to reach. The price is already above the 23.6 % and is looking toward 38.2% (273.55) . The GANN square of Nine shows important support and resistance for near term.

$jiofso this one being my biggest bag has reached its key reclaim zone
even if does get a dip btfd since this is going to new ath from here
given the fact that reliance is on full send this should also move along
either way in this for a long term so shall check in at 347 next where ill book some profits to reward myself and let the rest run
doubt we see 231 from here on but if given back up the truck

Jio mere lalA clear uptrend is evolving on the chart with a strong base building around the IPO levels.
One should look for investing around these levels and sit with patience for a target of around 480/500.

Positional Setup for JIOFIN (Jio Financial Services Ltd) – 1D Ch
🟢 Current Market Price: ₹246.47
🟢 Change Today: +1.73%
📈 Technical Observations:
The stock is showing signs of reversal from its recent bottom around ₹204–₹214.
It has broken out above multiple resistance zones in the ₹232–₹246 range, showing strength.
A breakout above ₹248–₹255 will confirm a short-term trend reversal.
Next supply zones lie around ₹266, ₹277 and ₹306.
✅ Positional Trade Setup
🎯 Entry Zones:
✅ Current Levels: ₹245–₹248
✅ Add More: On close above ₹255 (for confirmation)
📌 Targets:
🎯 Target 1: ₹266
🎯 Target 2: ₹277
🎯 Target 3: ₹305–₹310
📉 Stop-Loss:
🔻 SL: ₹232 (below support cluster & recent breakout zone)
⏳ Time Horizon:
3–6 weeks (for initial targets)
🧠 Technical Confluence:
The stock is forming a rounding base pattern after a sharp fall — often a sign of trend change.
Strong support seen at ₹232 & ₹214 — accumulation zone.
Close above ₹255 will take it into higher zones with strong potential.

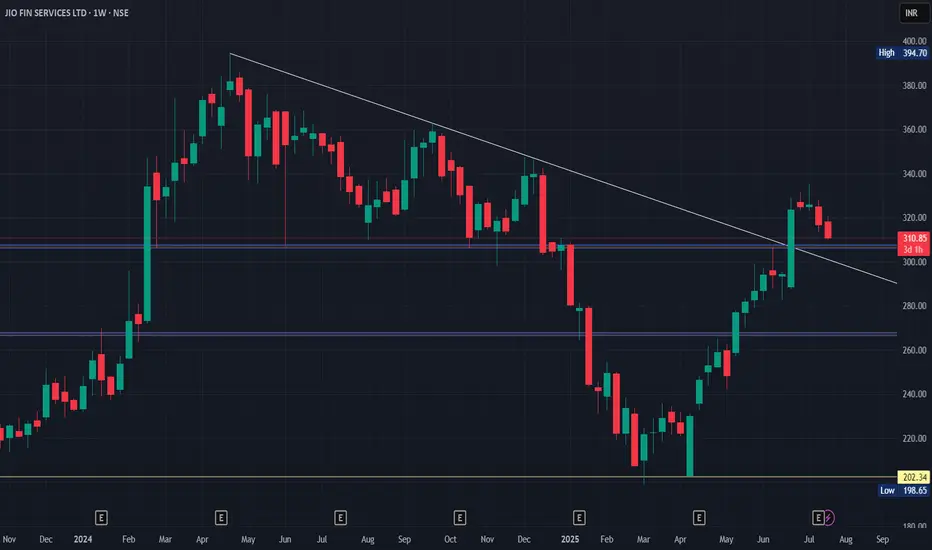
Is jio finance break the long term trendHey,
The trendline drawn here is crucial juncture for jio finance.
We can witness bull phase if the trendline is broken decisively and price does not close below the trend line.
The bull phase may take jio to higher side
this is not a recommendation pls take advice of your Fa.

$JIO F - BTFD mode V shape recovery in progress like it sliced through all supports on the way up should be the same way since no levels were built
congratz if you bought the fear
and the sweep of 204 .First key level to reclaim is 265 above where all the good news will start rolling out
looks like the inclusion in nifty50 should take us to 265 easily
price discovery to the upside will happen it's a matter of when not IF
