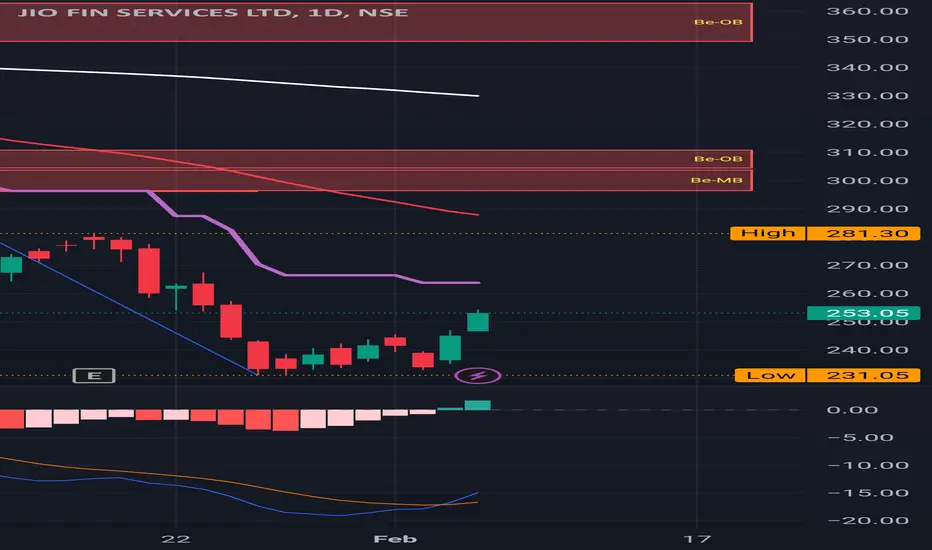
JIOFIN - ATL Level.- The chart is self-explanatory as always.
- JIOFIN is reaching its ATL.
- The stock is down 40% since it started its downward trajectory.
- JIOFIN is to be added to Nifty50 by March end
-The company reported a slight 0.32% increase in consolidated net profit for Q3 FY25, with earnings of Rs 294.78 crore compared to Rs 293.82 crore in the same period last year. Revenue from operations rose by 5.98% to Rs 438.35 crore for the quarter ending December 2024.
Disclaimer: This analysis is purely for educational purposes and does not constitute trading advice. I am not a SEBI-registered advisor, and trading involves significant risk. Please consult with a financial advisor before making any investment decisions.
JIOFIN trade ideas

Jio Fin Services Ltd *Jio Fin Services Ltd*
*W* - Multiple levels on Daily Basis.
Volume building up. Retracement from bottom levels.
*Trail SL with Upside*
*Book Profit as per Risk Appetite*
*This is an Opinion. Do your own research.*
*_Happy Investing_*🤓

Jio : Recovering well from the support of 230.Jio : Recovering well from the support of 230.
Important levels to watch for are 280 / 310.
MACD positive crossover has already happened and moving towards 0 .
( Not a Buy / Sell Recommendation
Do your own due diligence ,Market is subject to risks, This is my own view and for learning only .)
$JIOF- are we done yet?cleared up earlier chart zoomed out
already deployed more into this at 247 and still want more
approaching where the initial impulse began from so should see a healthy reaction IF we go there
no brainer buy and forget IF you are on the sidelines or have ammo
should go up the same way it came down with niftyy50 inclusion expected to be announced in Feb .
followed by tonnes of catalysts moving into 2025 .

$JIOF- PlantTheSeedDamn never thought it would get hammered so bad
but here we are sweeping liquidty and a close below key level
assuming nifty has one final wick down then up this should ideally build a base here and attempt breakout of downtrend around March
RSI is reset just need it to curl up fair bit down so gonna add some here as planned

JioFin is bouncing from supportsJio Finance is down 32% from highs !!
Currently stock is around the support area
Stock is all set to bounce back as weekly candle is Doji
Stock may double from here
Keep it in radar
Thank You !!

$JIOF-LTF long term play Hey so updating this on LTF since this has ended up being my biggest bag in equities
loving the candle on the weekly with a nice wick and reaction from HTF support at yellow line below
small pullback to test the channel low and we go for the first imp hurdle or the 7ema on the D3 to reclaim our trend ( dashed line ) step one would be our all important reclaim with acceleration above step 2
doubt we go back to the yellow line IF we do will only add more below it
Long term play this is the time to plant the seed imho
check back 2028

SWING IDEA - JIO FINANCIAL SERVICESJio Financial Services , an emerging force in the financial sector, exhibits signs of a potential upward move, presenting a swing trading opportunity.
Reasons are listed below :
Strong Support Zone at 300 : This level has proven to be a strong support, enhancing the likelihood of a bounce.
Bullish Hammer on Weekly Timeframe : A bullish hammer candlestick pattern indicates potential reversal and buyer interest at lower levels.
0.5 Fibonacci Support : The price is aligned with the 0.5 Fibonacci retracement level, suggesting that it could act as a springboard for further upward movement.
50 EMA Support on Weekly Timeframe : Trading above the 50 EMA adds to the bullish outlook and provides an additional layer of support.
Target - 360 // 385
Stoploss - weekly close below 295
DISCLAIMER -
Decisions to buy, sell, hold or trade in securities, commodities and other investments involve risk and are best made based on the advice of qualified financial professionals. Any trading in securities or other investments involves a risk of substantial losses. The practice of "Day Trading" involves particularly high risks and can cause you to lose substantial sums of money. Before undertaking any trading program, you should consult a qualified financial professional. Please consider carefully whether such trading is suitable for you in light of your financial condition and ability to bear financial risks. Under no circumstances shall we be liable for any loss or damage you or anyone else incurs as a result of any trading or investment activity that you or anyone else engages in based on any information or material you receive through TradingView or our services.
@visionary.growth.insights

JIOFIN- AnalysisBest entry in this stock is around 250 to 230 if comes comes to this levels, otherwise below is my analysis as per current data for the stock.
Bullish Levels -Above 244 then 343 to 362 New entry day closing above this then 470 then 588 then 706 then 823
Bearish levels :- Day closing below 225 (SL for Long term Investor) then 126 to 117 or 107
below this more bearish.
**Consider some Points buffer in above levels
**Disclaimer -
I am not a SEBI registered analyst or advisor. I does not represent or endorse the accuracy or reliability of any information, conversation, or content. Stock trading is inherently risky and the users agree to assume complete and full responsibility for the outcomes of all trading decisions that they make, including but not limited to loss of capital. None of these communications should be construed as an offer to buy or sell securities, nor advice to do so. The users understands and acknowledges that there is a very high risk involved in trading securities. By using this information, the user agrees that use of this information is entirely at their own risk.
Thank you.

Jio Finance Forming Bearish Cypher - Towards 270Jio Finance has formed Bearish Cypher "W" Pattern
This will take it to following targets
300 / 285 / 270

$jiofinadded a fair bit at range low 295ish
thought it would take liquidity and reclaim it on the weekly
for now no brainer buy but no one wants to buy or has no ammo left to deploy
doubt we dip to the yellow line below or previous range high
would defo add there

Jio Finance will be next multibaggerThis is daily chart timeframe of Jio Finance
Stock has not given returns from last 9 months
Stock is making symmetrical triangle pattern after a huge uptrend
This shows strong bullishness in a stock
Currently stock is around 300 and stock has strong support around 280-300
We can get bounce from here on and may get breakout of this symmetric triangle
Thank You !!

#SWINGTRADE SETUP - JIO FIN SERVICES NSE:JIOFIN
❇️ Strong volume breakout on daily chart.
❇️ Flag and poll pattern in bigger time frame (1day, weekly,monthly).
❇️ Stock can achive 320 to 350 target range in upcoming days/weeks.
❇️ Short and log terms targets 340+ (10%).
❇️ Nearby support(sl) 295.
❇️ Above 310 we can see a real move🔥
👉🏻 thetradeforecast
Only for educational purposes.
This content is not a recommendation to buy and sell.
Not SEBI REGISTRAR.

Consolidation phase in #jiofinStocks is in consolidation phase. It at support level which is 50% level. If break it can show strong move in break out/down side..

$NSE:JIOFIN 50% UP?A beautiful Flag and pole pattern on 1D Time frame, with a continued regression pattern being played out here. Opportunity: Triangle Breakout
Short term/ weekly view (10%capture) :
Entry- 325.5 exit@357 , if falls
further accumulation (same lot as before) @ 314 then exit @ 345
further accumulation (same lot as before) @ 303.5 then exit @ 325.5
Long term/ monthly view (50%-70%) :
Entry @324-325
Accumulation @299/325/374-357
Exit @448 (50%) or @514 (70%)

JIOFIN 1D TFAs discussed in the previous posts NSE:JIOFIN , which came back after gaining liquidity from the demand zone is now forming a trend line with 3 touch points. The stock could be traded once it breaks out of the trend line. A good risk reward ratio of 1:1.5 can be gained from this trade.
We have discussed this more on our previous post. You can view the previous post by clicking the attachment below this post.
Disclaimer:- This analysis is only for educational purpose. Please always do your own analysis or consult with your financial advisor before taking any kind of trades

JIO-FINANCEJIO-FINANCE
Jio Finance is approaching the completion of its Wave 2 correction, with the 50% retracement from the 0-5 wave structure already achieved. The chart suggests a potential breakout from the 4th wave of the C leg in the Y structure. If the price surpasses the 4th wave's high, we could see further upward movement. Additionally, a break above the (B) wave would indicate the end of the downtrend and the start of a higher-degree Wave 3.
Disclaimer : This analysis is for informational and educational purposes only and should not be considered as financial advice. Always consult a professional before making investment decisions.

$JIOFINANCEno brainer buy with tonnes of good FA and the last quarter is usually good for finance sector or so i've heard
in terms of TA this is the best Risk/Reward for a while so load up strap in we going to flip range high above and continue higher
added on the sweep noticed the rsi is curling up in the bullish zone along with this being above the 200ema .. send.exe.loading

WILL JIO FINANCIAL SERVICE FLY HIGH LIKE EAGLE ???Good afternoon, It's been clear seen from weekly chart that JFS is forming Pole & Flag pattern which indicates the sign of bullishness in JFS.
Currently it is trading around 314 next target will be around 340-350 and if the stock will break the 350 level then next psychological resistance will be around 400 and if the bullish sentiment continues then very soon JFS backed by RIL will trade minimum around 500 or 500+.
SL will be around 265-270.
Note - This is not a buying recommendation it's my personal views.

expect good months from december in price action NSE:JIOFIN i have been following and trading in jiofin from levels of 210 and now i am anticipating the consolidation time to come near end and good 30% returms from current levels to be expected in next decmber2024 till may2025 expecting levels above 400 atleast in jiofin from here the consolidation has been done and now is the right time to add solid position in jiofin in next 20/30 days after that it should be all over media and news channel recomendation list NSE:JIOFIN

JIOFIN: Intraday and Swing Trading Opportunities
Timeframe: 15-Minute for Intraday & Multi-Day for Swing Traders.
Intraday Outlook: For aggressive traders, the Risological Indicator signals a confirmed bullish move with GREEN lines. If the GREEN indicator flips to RED, it’s time to book profits and exit the trade.
Swing Trade Outlook: Using the Risological Swing Trader, TP (Take Profit) targets are clearly marked:
TP1: 319.85
TP2: 333.35
TP3: 346.85
TP4: 355.20
Entry: 311.50
Stop Loss (SL): 304.75
This setup highlights the versatility of the Risological Indicator for both quick intraday decisions and strategic swing trades!

$JIO financepossible deviation to take a tonne of liquidity giving it enough fuel to break 329 level
anyone fancy a long term hodl
time to step up and go all in
iMHO
range low and stoch reset
