JK CEMENT RISING WEDGE BREAKOUT A 9%+ up move at a higher side of rising wedge, since it's on the wrong side breakout, we should be cautious and wait for more reactions. Trading is mostly psychology and a patience game. Stick to your rules and let market commit with you first and then you commit to the market.
JKCEMENT trade ideas

JK CEMENT | Strong Volume Breakout | Short-Term Upside in Play📈 Short-Term Trade Plan:
Buy Zone: ₹5,240–₹5,255 (on retest of breakout zone)
Target 1: ₹5,310
Target 2: ₹5,360
Stoploss: ₹5,195 (below the breakout candle wick)
🔍 Technical Insights:
Strong volume surge on breakout above ₹5,220–₹5,230 resistance zone.
RSI comfortably above 60, suggesting sustained strength.
Box breakout pattern typically suggests upward continuation with momentum.
for educational purposes only

JKCEMENTJKCEMENT given trendline breakout. It has posted v decent result above street's expectations. There is high probability that market may turn its trend which is in favor of new trend. Keep it on radar.

#jk cement near breakout zone1.In weekly timeframe we can witness strength.
2.volume has pickup in recent time.
3.If it sustain this level we can see rally in sometime.
4.It is above 20,50,200 ema.

Jk cement All is well
Good day
Just my view and educational purposes only I'm not a SEBI registered advisory...trade on your own risk.
This is simple ORB Strategy with volume breakout..i will enter EOD 3.25pm if the price trade above the blue line and after entry I will wait for my target or stoploss (D candle should close below the red line) in valid if direct not triggered and closed below red line..
Just a view educational purposes only

JKCEMENT : Strong Bullish Momentum with Possible BreakoutJK Cement Ltd. (NSE: JKCEMENT) has recently demonstrated strong bullish momentum, marked by significant price movements and key technical indicators that point towards a potential breakout. Investors and traders are closely watching this stock for further upward movement, making it an attractive candidate for a swing trade.
Key Highlights:
Possible Breakout
The recent price action in JK Cement Ltd. suggests a possible breakout from a previous resistance zone. The stock has surged past the ₹4894.23 resistance level, indicating strong buying interest and the potential for continued upward movement. This breakout is a bullish signal that could pave the way for higher price targets.
Strong Bullish Candle
In the latest trading session, JK Cement Ltd. formed a strong bullish candle, closing with a substantial gain of ₹150.60 (+3.25%). This candle not only signifies significant buying pressure but also breaks above key resistance levels, reinforcing the bullish sentiment. The strength of this bullish candle is a clear indicator of strong upward momentum.
RSI Breakout
While the RSI (Relative Strength Index) is not explicitly shown in the chart, the overall price movement suggests a possible RSI breakout. An RSI breakout above the 70 level typically indicates overbought conditions, reflecting strong bullish momentum. Such a breakout often attracts additional buyers, pushing the stock price higher.
Possible Swing Trade
Given the current technical setup, JK Cement Ltd. presents a compelling opportunity for a swing trade. The combination of a possible breakout, a strong bullish candle, and a potential RSI breakout indicates a high probability of continued upward movement. Swing traders can consider entering a long position, targeting the next resistance levels at ₹4999.42 and ₹5157.63. It is also prudent to set a stop-loss below the recent support level at ₹4630.83 to manage risk.
Additional Chart Patterns and Readings
Double Bottom Pattern
Upon further analysis, the chart reveals a potential double bottom pattern formed around the 13th of January. This pattern is a bullish reversal signal, indicating that the downtrend may have ended and a new uptrend could be starting. The breakout above the resistance zone further confirms this bullish reversal, adding to the positive outlook for JK Cement Ltd.
Volume Analysis
The volume bars at the bottom of the chart highlight a significant increase in trading volume on the most recent day. This 5-day volume breakout, where the volume is significantly higher than the average over the past five days, adds credibility to the price movement. The 5X volume breakout indicates strong participation from traders and investors, further validating the bullish sentiment.
Conclusion
JK Cement Ltd. is exhibiting strong bullish signals, with key technical indicators pointing towards a potential breakout and continued upward movement. The strong bullish candle, possible RSI breakout, and significant volume increase make it an attractive candidate for a swing trade. Traders should monitor the stock closely and consider entering a long position while managing risk with appropriate stop-loss levels.
With the current market setup, JK Cement Ltd. is poised for further gains, making it a stock to watch in the coming days. 📈🚀

JKCEMENTDisclaimer:
This is not financial advice. Please do your own research or consult with a financial advisor before making any investment decisions. Investments in stocks can be risky and may result in loss of capital.

jk cement - next big move in waitingJK Cement has formed a good cup and handle pattern and waiting for a valid breakout above the range of 4800 - 4820.. once it crosses the range then we plan to enter for a positional target of 5780-5800 - which is the equal to the depth of the cup reversed on upside.

JKCEMENT Ready for Breakout...NSE:JKCEMENT trade at 4670. You can watch for 5500-5600 level after breakout.

JKCEMENTJK CEMENT LTD has breakout 2 years resistance level and retest that level and this is just for educational purpose only

JKCEMENT broke out of long term resistanceJKCEMENT broke out of resistance in daily chart. There has been good volume on the breakout day. Ideal entry would be just above breakout candle with stop loss below breakout candle low. This trade provides low risk entry with ideal risk reward of 1:2.
If you like this idea please boost this idea or leave a comment below on what you think. Otherwise, happy trading :-)

Broadening Wedge Pattern in JKCEMENETOn Daily timeframe, Broadening wedge pattern breakout occured in JKCEMENT near 4600 level. after this breakout expected strong upside rally upto 5016+ level with intermediate target of 4800 in this stock. This breakout will fail if stock starts trading below 4450 level.

Bullish Setup with Favorable Risk/Reward in JK Cement LtdThis daily chart of JK Cement Ltd. shows a bullish trade setup with a clear risk/reward ratio of 2.39. The entry is placed at ₹4,454.70 with a stop loss set at ₹4,254.70, marking a downside risk of 3.41%. The target price is ₹4,763.60, providing an upside potential of 8.15%.
The recent bullish price action suggests a continuation of the uptrend, supported by strong buying interest. The trade is designed to capitalize on this momentum, with a calculated position size to manage risk effectively.
Key Levels:
Entry: ₹4,454.70
Stop Loss: ₹4,254.70 (3.41% risk)
Target: ₹4,763.60 (8.15% upside)
Risk/Reward Ratio: 2.39
Analysis: The trade setup offers an attractive risk/reward profile, with potential gains outweighing the risk by a factor of 2.39. Traders should monitor the price action closely as it approaches the target level and consider adjusting stops to lock in profits as the trade progresses.

Crossover - JKCEMENT📊 Script: JKCEMENT
📊 Sector: Cement
📊 Industry: Cement
Key highlights: 💡⚡
📈 Script is trading at upper band of BB.
📈 MACD and Double Moving Averages are giving crossover .
📈 Right now RSI is around 60.
📈 One can go for Swing Trade.
⏱️ C.M.P 📑💰- 4480
🟢 Target 🎯🏆 - 4715
⚠️ Stoploss ☠️🚫 - 4387
⚠️ Important: Always maintain your Risk & Reward Ratio.
✅Like and follow to never miss a new idea!✅
Disclaimer: I am not SEBI Registered Advisor. My posts are purely for training and educational purposes.
Eat🍜 Sleep😴 TradingView📈 Repeat 🔁
Happy learning with trading. Cheers!🥂

JKCEMENTNSE:JKCEMENT
trading at good price
can buy at 4200 and add till 4150
sl- 4000
Target will be 4227/4382/4467/4557
rsi>40
MA short term in BUYYYY

JKCEMENT: A Potential Rebound PlayJKCEMENT, a leading cement manufacturer, has been trading on the National Stock Exchange (NSE) at a current market price (CMP) of Rs. 4310.
After a recent pullback from its 50-day long candle midpoint of Rs. 4200, the stock is showing signs of a potential rebound. Technical Analysis The stock's recent price action has been characterized by a bounce back from the 50-day long candle midpoint, indicating a potential reversal in trend.
The Linear Regression Channel (LRC) indicator , which plots the stock's price movements against its volume, is also showing signs of expansion in the upward direction. This suggests that the stock's upward momentum is likely to continue.
Long Candle Midpoint The Long Candle Midpoint (LCM) indicator, which plots the midpoint of a long candle, is also indicating a potential rebound. The LCM is plotted at the midpoint of the long candle, which is calculated based on the stock's price movements over a specified period. In this case, the LCM is plotted at Rs. 4200, which is the midpoint of the long candle that formed earlier.
Conclusion Based on the technical analysis, JKCEMENT appears to be a potential rebound play. The stock's recent price action has been characterized by a bounce back from the 50-day long candle midpoint, and the LRC indicator is showing signs of expansion in the upward direction. Additionally, the LCM indicator is also indicating a potential rebound. Therefore, investors may consider taking a long position in the stock, with a stop loss at Rs. 4200 and a target price of Rs. 4500.
Disclaimer This blog post is for informational purposes only and should not be considered as investment advice. It is essential to do your own research and consult with a financial advisor before making any investment decisions.

buyThe stock gave a retest breakout of falling channel with good volumes and closed above previous 3 days with good recovery from today's low to close indicating buying interest in the stock. Near target is 4300.

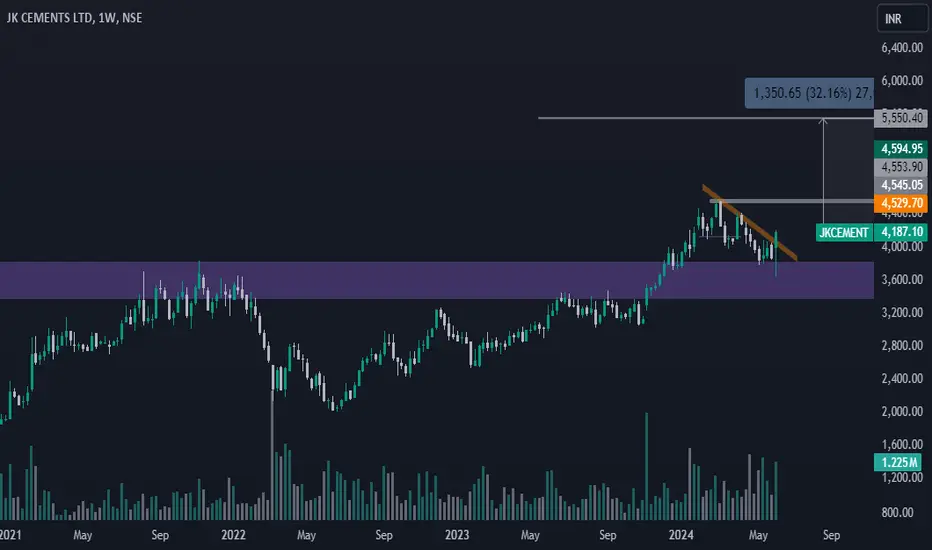
JK CEMENT This stock breakout and retest major levels and TGT upto 5550 and sl 3640
and this is only for educational purpose
JKCEMENT 1WEEKWAIT FOR A SMALL CONFORMATION
.
.
.
.
.
I Am Not SEBI Registered Analyst. All Post and Levels Posting is only for educational and knowledge purpose. I Am not responsible for your any kind of loss or profit.
No Claim, All Rights Reserved.‼️


JK CEMENTS LTDThis stock breakout cup and handle pattern TGT will be 1:3 risk reward
and only for educational purpose

