JKTYRE trade ideas

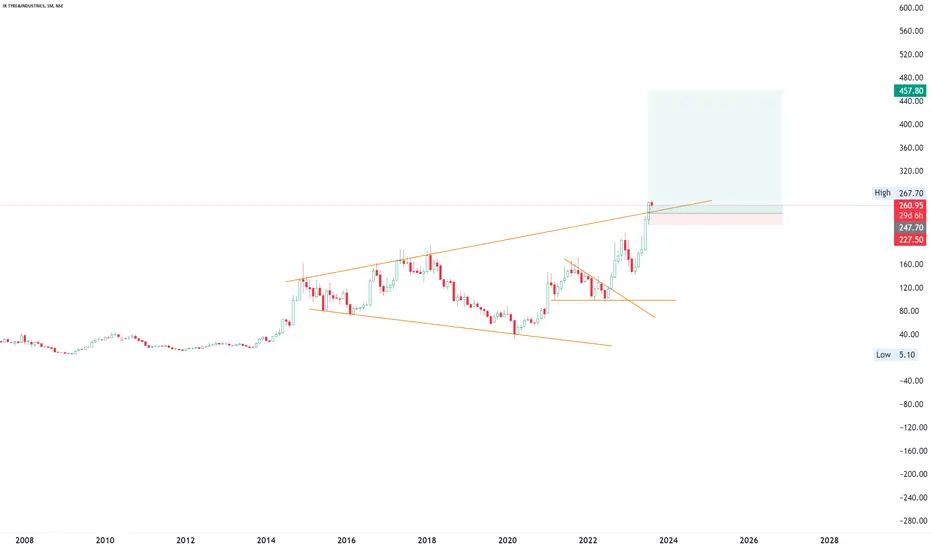
JK Tyre & Industries LtdSmall cap,
FII ,DII's Increased share holdings ,
Trading in triangle pattern.
5th Elliott wave is pending ,
Trade as per your financial adviser.

JKTYRE & INDUSTRIES LTD S/RSupport and Resistance Levels:
Support Levels: These are price points (green line/share) where a downward trend may be halted due to a concentration of buying interest. Imagine them as a safety net where buyers step in, preventing further decline.
Resistance Levels: Conversely, resistance levels (red line/shade) are where upward trends might stall due to increased selling interest. They act like a ceiling where sellers come in to push prices down.
Breakouts:
Bullish Breakout: When the price moves above resistance, it often indicates strong buying interest and the potential for a continued uptrend. Traders may view this as a signal to buy or hold.
Bearish Breakout: When the price falls below support, it can signal strong selling interest and the potential for a continued downtrend. Traders might see this as a cue to sell or avoid buying.
20 EMA (Exponential Moving Average):
Above 20 EMA: If the stock price is above the 20 EMA, it suggests a potential uptrend or bullish momentum.
Below 20 EMA: If the stock price is below the 20 EMA, it indicates a potential downtrend or bearish momentum.
Trendline: A trendline is a straight line drawn on a chart to represent the general direction of a data point set.
Uptrend Line: Drawn by connecting the lows in an upward trend. Indicates that the price is moving higher over time. Acts as a support level, where prices tend to bounce upward.
Downtrend Line: Drawn by connecting the highs in a downward trend. Indicates that the price is moving lower over time. It acts as a resistance level, where prices tend to drop.
RSI: RSI readings greater than the 70 level are overbought territory, and RSI readings lower than the 30 level are considered oversold territory.
Combining RSI with Support and Resistance:
Support Level: This is a price level where a stock tends to find buying interest, preventing it from falling further. If RSI is showing an oversold condition (below 30) and the price is near or at a strong support level, it could be a good buy signal.
Resistance Level: This is a price level where a stock tends to find selling interest, preventing it from rising further. If RSI is showing an overbought condition (above 70) and the price is near or at a strong resistance level, it could be a signal to sell or short the asset.
Disclaimer:
I am not a SEBI registered. The information provided here is for learning purposes only and should not be interpreted as financial advice. Consider the broader market context and consult with a qualified financial advisor before making investment decisions.

SWING IDEA - JKTYREWeekly MACD is about to make a crossover on NSE:JKTYRE . Once this crossover happens successfully, it could trigger a good move upward.
Company seems to be performing really well since last few years. We also have some good positive ratings as well from Analysts and good Earnings Report as well.
While the weekly charts looks good, the Monthly chart is not entirely convincing yet. Take this trade based on your Risk Appetite and Risk Management.

BUy Setup Currently Trading At 420 , Buy And Buy More If any Slide If happens till 376 For The target 498
Something cooking in This script

JK Tyre is jumping after forming a baseJK Tyre & Industries Ltd. manufactures tyres, tubes and flaps. JK Tyre & Industries Ltd is one of the leading automotive tyre manufacturers in India. The company mainly develops, manufactures, markets and distributes automotive tyres, tubes, flaps and retreads. It markets tyres for sale to vehicle manufacturers for fitment as original equipment and for sale in replacement markets. The company has manufacturing plants located in India and Mexico with worldwide distribution.
JK Tyre & Industries Ltd CMP is 429.75. The positive aspects of the company are Company reducing Debt, Company with Zero Promoter Pledge, Annual Net Profits improving and Improving Cash Flow from operation. The Negative aspects of the company are MFs decreased their shareholding last quarter, Companies not able to generate net cash and Increasing Trend in Non-Core Income.
Entry can be taken after closing above 434. Targets in the stock will be 446, 471, 486 and 500. The long-term target in the stock will be 515, 534 and 554. Stop loss in the stock should be maintained at Closing below 382 or 359 depending on your risk taking ability.
The above information is provided for educational purpose, analysis and paper trading only. Please don't treat this as a buy or sell recommendation for the stock. We do not guarantee any success in highly volatile market or otherwise. Stock market investment is subject to market risks which include global and regional risks. We will not be responsible for any Profit or loss that may occur due to any financial decision taken based on any data provided in this message.

Jk tyre looking good to buyJk tyre looking good to buy
Wait for resistance breakout then enter
For swing trading
Target for 500-530
This is only for education purpose

JKTYRES TARGET 498 STOP LOSS 416Script breakout from the downtrend day chart channel and weekly inverted head and shoulder formation with the bullish mode in one hour with good accumulation volume increasing. Highly possible to break out from the resistance of 437 and 445. If breaks both the resistance in the next week it will reach the first target of 463 and the next target of 498.

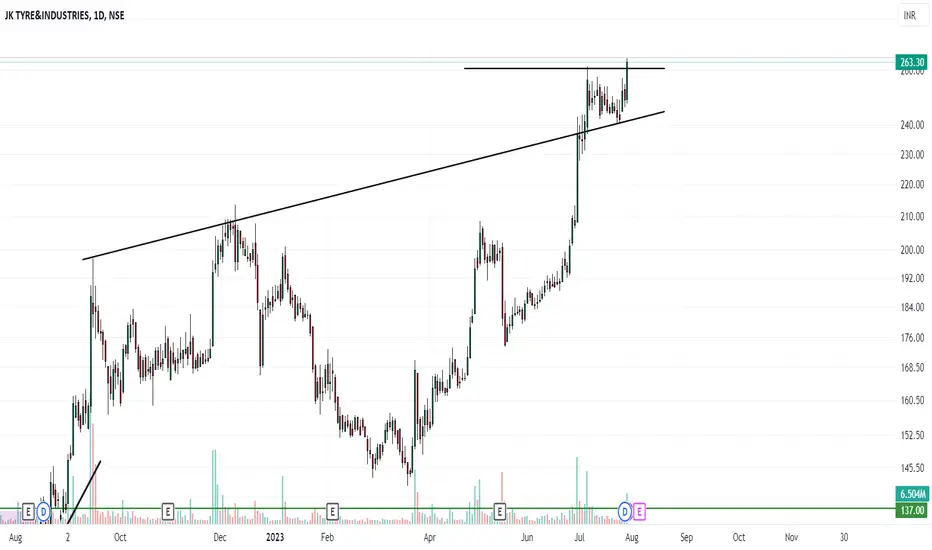
JKTYRENSE:JKTYRE
One Can Enter Now ! Or Wait for Retest of the Trendline (BO) Or wait For better R:R ratio
Note :
1.One Can Go long with a Strict SL below the Trendline or Swing Low of Daily Candle.
2. Close, should be good and Clean.
3. R:R ratio should be 1 :2 minimum
4. Plan as per your RISK appetite
Disclaimer : You are responsible for your Profits and loss, Shared for Educational purpose
JK TYRE - Cup & Handle Breakout Cup & Handle pattern breakout done in JK TYRE
Please kindly wait for Retesting the level 205
You just keep an eye on this stock
I will update instantly about this stock
Disclaimer - All information on this page is for educational purposes only,
we are not SEBI Registered, Please consult a SEBI registered financial advisor for your financial matters before investing And taking any decision. We are not responsible for any profit/loss you made.
HAPPY TRADING GUYS


JKTYRE - Ichimoku BreakoutStock Name - Jk Tyre & Industries Limited
Ichimoku Cloud Setup :
1). Today's close is above the Conversion Line
2). Future Kumo is Turning Bullish
3). Chikou span is slanting upwards
All these parameters are showing bullishness at Current Market Price
and more bullishness AFTER crossing 391
#This is not Buy and Sell recommendation to any one. This is for education purpose and a helping hand to learn trading in Market.
#CloudTrading
#IchimokuCloud
#IchimokuFollowers
#Ichimokuexpert
I hope you all like my analysis.
Please do share your thoughts into comment section.
Please give a like, share & subscribe for daily analysis.

Bullish on JK TYRE Jk tyre buy above 290+
SL 275
Target 340
Disclaimer - This is not a buy and sell tips it's only for education purpose analysis. We are not responsible for your profit and loss.
#swastik capital

jk tyre industries buy @ cmp or wait for retracement jk tyre industries buy @ cmp or wait for retracement
triangle breakout
risk reward 1.5
sl@176

#JKTYRE 278 Buy Recommended TGT 325 (17%) SL 250 - Rachit SethiaJKTYRE 278
TGT 325
SL 250
RR > 1.8
TF < 6M
RETURN > 17%
NSE:JKTYRE
Factors: BULLISH WEDGE BREAKOUT Trend Following Rising Volume with rising Prices. Flag pattern breakout. Pennant Pattern Breakout with Bullish Candle. Retest Successful. Higher Highs & Higher Lows. Broken above RESISTANCE levels Trading at SUPPORT levels Earnings are strong. Bullish Wedge Breakout Risk Return Ratio is healthy. And Rising from Double Bottom Pattern to Flag Pattern forming. If you like my work KINDLY LIKE SHARE & FOLLOW this page for free Stock Recommendations. With 💚 from Rachit Sethia

JKTYRE - Swing LongJKTYRE is traveling above 50 SMA and has given a breakout with huge volumes.
Stock P/E - 19.6
FII has increased the stacks
Breakout with volumes.

JK tyres Entry after retest at breakout level
Trading with good volumes
Time frane - 10-15 days
-- DISCLAIMER --
I am not a financial advisor or SEBI registered.
This is just a view.
Please DO YOUR OWN RESEARCH before investing in any stock.
Happy trading.
Peace.


Swing tradeThese are swing idea's which you can add your watchlist and analysis for yourself.
Keep on radar.
Potential upside stock!

Resistance BreakoutPlease look into the chart for a detailed understanding.
Consider these for short-term & swing trades with 2% profit.
For BTST trades consider booking
target for 1% - 2%
For long-term trades look out for resistance drawn above closing.
Please consider these ideas for educational purpose

Jk Tyres-Nice BreakoutJk Tyres-Nice Breakout
Capital to be deployed- 20k
Investing Price -250-252
Breakout Price -249
Stoploss -216
Targets -412
#jktyres #StocksInFocus #StocksToBuy #stockstowatch #stocks #StocksInNews #SwingTrading #BREAKOUTSTOCKS

JKTyre - MAJOR RESISTANCE Zone 224JKTYRE :- Big Breakout Zone Trendline Resistance 224
Time Frame - MONTHLY
OBJECTIVE -
1. Major Trendline Resistance 224
2. Above monthly closing above 224 door will be open for 284 336 444 524+++
3. if respect major Resistance Zone than fresh buying area will be 124 144 with stops 100
4. someone can say CUP & HANDLE patterns formation
Trade 💡 - Either wait for Proper BO above 224
or
go long near 150 add more 124 stops 100
