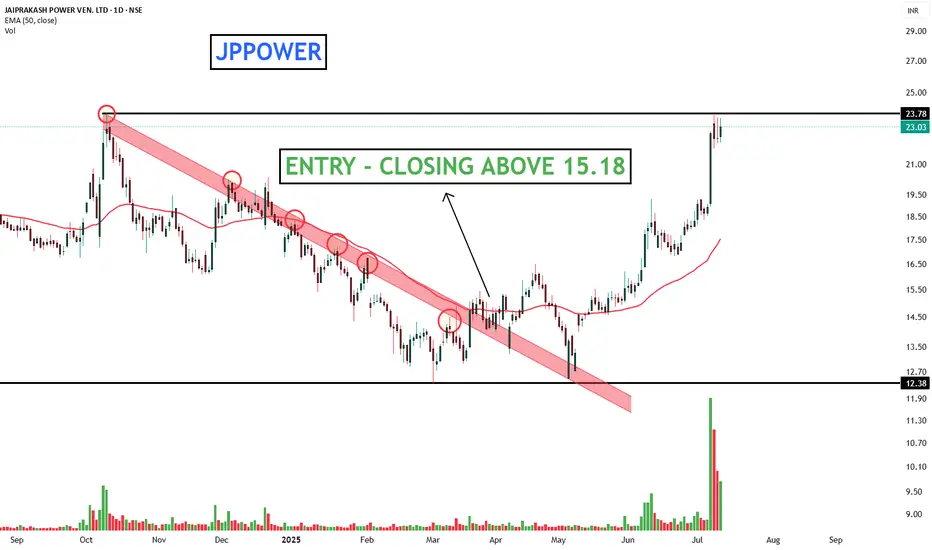
JP POWERBased on the setup that i have been recently using for my swing trading, JP Power is one such stock that has entered my radar.
The stock is in the golden zone drew from swing low to swing high.
Waiting for a sign of reversal towards upside
Can try this stock as well if shows sign of reversal, ( Volume rising, EMA)
SL below Golden zone
JPPOWER trade ideas
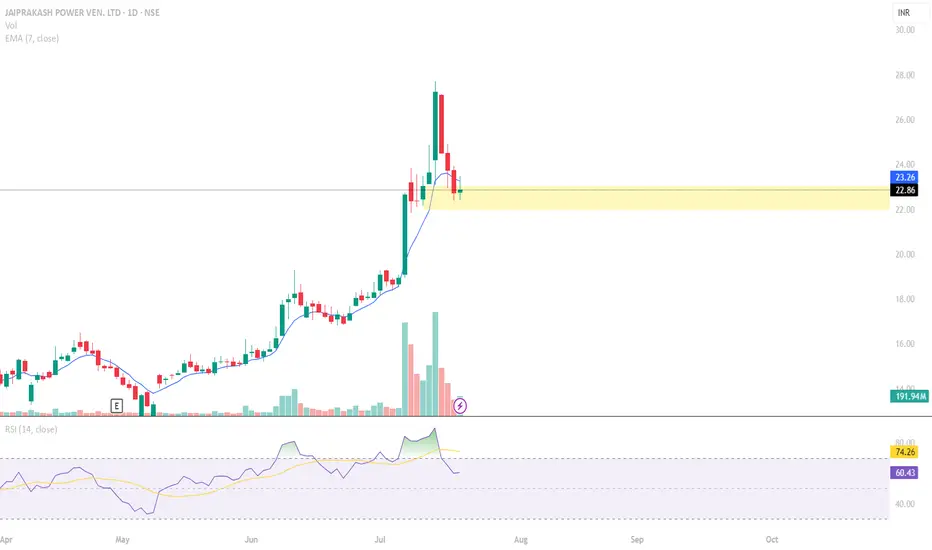
JPPOWER - TARGET REACHED - CLOSING POSITIONS.Shared this stock a while ago here in the community.
I am Abhishek Srivastava | SEBI-Certified Research and Equity Derivative Analyst from Delhi with 4+ years of experience.
I focus on simplifying equity markets through technical analysis. On Trading View, I share easy-to-understand insights to help traders and investors make better decisions.
Kindly check my older shared stock results on my profile to make a firm decision to invest in this.
Kindly dm for further assistance it is for free just for this stock.
Thank you and invest wisely.
CLOSING NEEDED ABOVE A LEVEL - JPPOWER Everything is pretty much explained in the picture itself.
I am Abhishek Srivastava | SEBI-Certified Research and Equity Derivative Analyst from Delhi with 4+ years of experience.
I focus on simplifying equity markets through technical analysis. On Trading View, I share easy-to-understand insights to help traders and investors make better decisions.
Kindly check my older shared stock results on my profile to make a firm decision to invest in this.
Kindly dm for further assistance it is for free just for this stock.
Thank you and invest wisely.

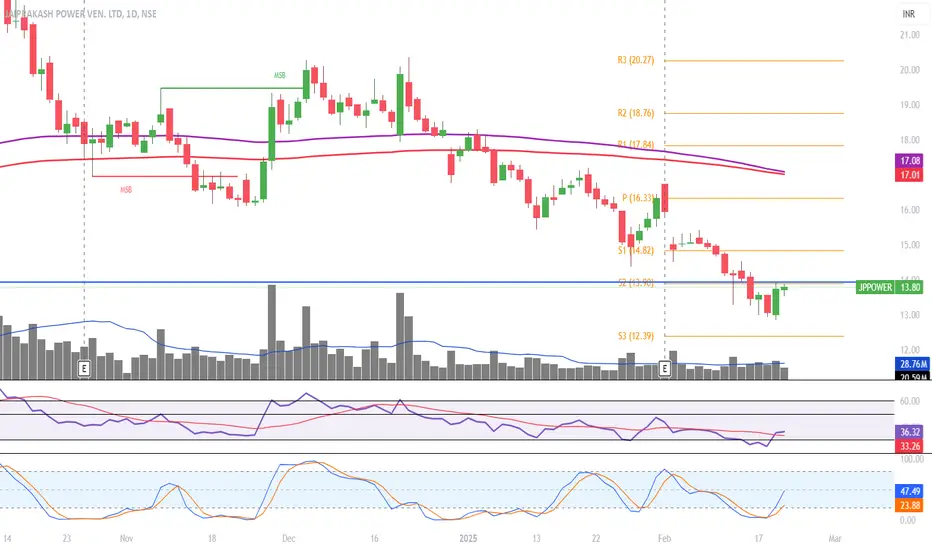
Watch out for good levels tomorrowReversal for bottom, RSI and stochastic rsi are favourable. Can be a good swing trade
Stock Analysis: JPPOWER📊 Stock Analysis: JPPOWER
🔹 Buy Trigger: Above ₹20.20
🔹 Target (T1): ₹30.00 (+48%) 🎯
🔹 Volume Insights: Increasing relative volume (RVol: 143%) indicates strong interest.
📈 Current Observations:
Consolidation near resistance with bullish momentum.
Strong support evident from the accumulation zone.
🛠 Strategy:
Buy on breakout above ₹20.20 with a target of ₹30. Manage risk with a stop loss below key support levels.
What’s your plan for JPPOWER? Let me know in the comments!
🔍 Stay tuned for more insights
#StockMarket #JPPOWER #TechnicalAnalysis #Breakout #Trading

$JP Power closing above INR 11-12 will be positiveInverse Head and Shoulders Pattern : The inverse head and shoulders pattern is a bullish reversal pattern that typically occurs after a downtrend. It consists of three main parts:
Left Shoulder: This is the first low point of the pattern and is followed by a rally.
Head: The head is the lowest point of the pattern and is formed after the left shoulder. It's a deeper low, indicating increased selling pressure.
Right Shoulder : The right shoulder is the final low before the trend reversal. It is followed by another rally, which indicates the potential for a bullish reversal.
JP Power Stock Analysis:
Looking at the JP Power stock, it appears that it may be forming an inverse head and shoulders pattern on the monthly chart. Here are my comments on this potential pattern:
The stock has been in a downtrend, as indicated by the left shoulder, followed by a deeper low in the form of the head.
If JP Power's closing price rises and holds above INR 11-12 on the monthly chart, this would be a positive sign. It suggests that the right shoulder is forming, and the pattern might be in play.
The inverse head and shoulders pattern's completion could signal a trend reversal from bearish to bullish. This could lead to a potential target (TGT) in the range of INR 20 to INR 25.
However, it's important to remember that technical patterns are not guaranteed, and it's crucial to consider other factors such as volume and overall market conditions before making trading decisions.
Traders and investors should monitor the stock's price action, volume, and the confirmation of the pattern before making any investment decisions.
Please note that this is a general analysis based on the provided information, and it's essential to conduct thorough research and consider various factors before making any financial decisions related to the JP Power stock.

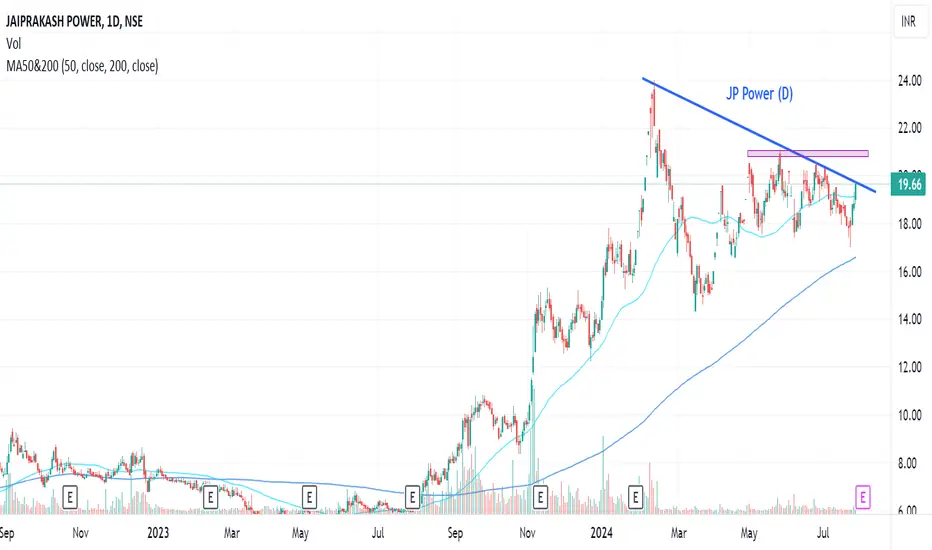
JPPOWERThis Stock is making a upward Triangle Pattern. If the Stock crosses 24 price mark. It can give a great momentum upwards.

JP Power Break out, if above Triangle, Targets Rs 30 and Rs 42JP power is found OK in Fundamental Analysis, with normal positives. From Feb 2024 high price, consolidated in a Triange format. If breaks above the Triangle, Price targets possible till Feb 2025 are Rs 30 and Rs 42. Only for educational purposes and not a trade advice.


JP Power chart analysisJP Power chart analysis on daily time frame. Please share your valuable feedback. Please follow for more.
If it breaks the trendline then first target could be around 21. Else you can for it to go past 21.
jp powerhello,
i am bullish on jp power after looked weekly chart. there is possibility to became higher high this stock, sl 15

JPPOWER - Long Term Buying Opportunity (Bullish Momentum)Jaiprakash Power (JPPOWER) Technical Analysis :- As per previous chart history and current chart pattern, it is observed that the current trend is mixed but as per my technical knowledge this is the right time to buy this stock and hold for short to long term for maximum profit. Here's a summary of the technical analysis for JPPOWER:
Indicators are mixed:
Short-term technical are bearish (sell) while long-term show a buying trend. Also, signals range from buy to strong sell depending on the indicator and time frame. Overall rating is a sell but I am still buying this stock.
Recent Price Movement: - JPPOWER has been in a downtrend recently, but volume hasn't been high to confirm the strength of the bearish move. This is the main reason of my prediction to buy this stock and hold.
Other things to consider:- The MACD indicator is showing a positive sign, suggesting a potential uptrend. Secondly, it is showing an ascending triangle pattern on the chart, which could indicate a breakout to the upside if confirmed.
Overall: - The technical analysis for JPPOWER is inconclusive. While there are some bearish signals, there are also signs that a reversal could be coming. It's important to do your own research and consider other factors before making any investment decisions.
Disclaimer: I am not a financial advisor and this is not financial advice. Please do your own research before making any investment decisions because I am not SEBI registered
Thanks for your support as always

JP Power is ready to give a huge moveJP Power has completed a long-term inverted Head and Shoulder pattern recently. Considering this positive move, we should expect a move up to double the current levels from 10.50.
Keep tracking the move and invest sensibly.

JP POWERShowing improvement in fundamental. Also showing double bottom pattern in weekly time frame also supported by key moving average. And the volume is also high in last 2weeks. price down with very low volume.
If this stock we get near 6.8 then it will be gud buy. sl will be 5.8.
Target will be very high. in one year it will be near 11.
it has gud potential upside target. follow strick sl & proper risk reward ratio. this is the only holy grail in the market.

$JPPOWERgot some spot
obv is going loco so expecting continuation.
invalid below range low
targeting blue line first

will jp power become the next suzlonthe stock has come out of a flag pattern after an 80% rally and a good consolidation
with reducing volume during consolidation and increasing volume during break out and the over all power sector is on fire


Very Bullish On montly Chart.In 2024 It can show multibagger returns, but it will be 80% Tukka. I would definitely play the bet.

JP power stocks head and inverse shoulder chart patternThe JP power restocks stay near stone downtrend so convert to up trend volume actions is very good and a technical analysis based on create a bottom buying inverse head and shoulder chart pattern the near term the stocks are short term target 25 and long term stocks target all time high price 85 the stocks are very very bullish on the basis of technical analysis and volume action projection the big player entry in bottom buying so the stocks are fast moving upside

💥Jaiprakash Power 💥-Nice Breakout💥Jaiprakash Power 💥-Nice Breakout
Capital to be deployed- 20k
Investing Price -10-11
Breakout Price-10
Stoploss-8
Targets-15-17-22
RT for max reach
#jppower #StocksToBuy #stocks #StocksToTrade #StocksInFocus #stockstowatch #StocksInNews

A Cup and Handle pattern breakout.
This time in this stock we can clearly see there is an breakout in cup and handle pattern. But the most important thing is that, whenever stock increases volume also increases. And stock have break its upper resistance with good volume. So this is also a perfect breakout. And also a perfect stock have in a portfolio.

Resistance Breakout - JPPOWERPlease look into the chart for a detailed understanding.
Consider these for short-term & swing trades with 2% profit.
For BTST trades consider booking
target for 1% - 2%
For long-term trades look out for resistance drawn above closing.
Please consider these ideas for educational purpose
Please note that, if there are some big targets, those are drawn thinking for long term.

#JPPOWER SHORT TRADE IDEA SETUPGreetings Folks,
today i have prepared a setup of JPPOWER on NSE
the analysis is as follows
- the price is in bearish structure right now
- we have some liquidity build up which adds to confirmation for our short
- 2 possible area for trades
- the zone above BSL is more favorable for our trade
dont play with fire, always use a predefined stoploss
