#JPPOWER INTRADAY TRADE SETUPGreetings Folks,
today i have prepared a setup of JPPOWER on NSE
the analysis is as follows
- the price made a required retracement
- i have marked SSL which is also very important support because if it gets broken it may indicate the start of a micro bearish trend
- there is also a minor range which is also marked in the chart
- the railway narrative seems to be overrated now so trade with cautious
dont play with fire, always use predefined stoploss
JPPOWER trade ideas

JP POWERthis company has reduced its debt significantly is last few years
its in profit since 2021
wits well beolw moving averages
will it go up?
TARGET 1 -8.40 ATH-11

#JPPOWER TRADE IDEA SETUP Greetings Folks,
today i have prepared a setup on JPPOWER on NSE
the analysis is as follows
- past few days this stock has been performing well
- following a dynamic support trendline
- currently testing a static resistance which is about to break
- if tomorrow opens gap up, wait for a retest for entry
dont play with fire, always use predefined stoploss

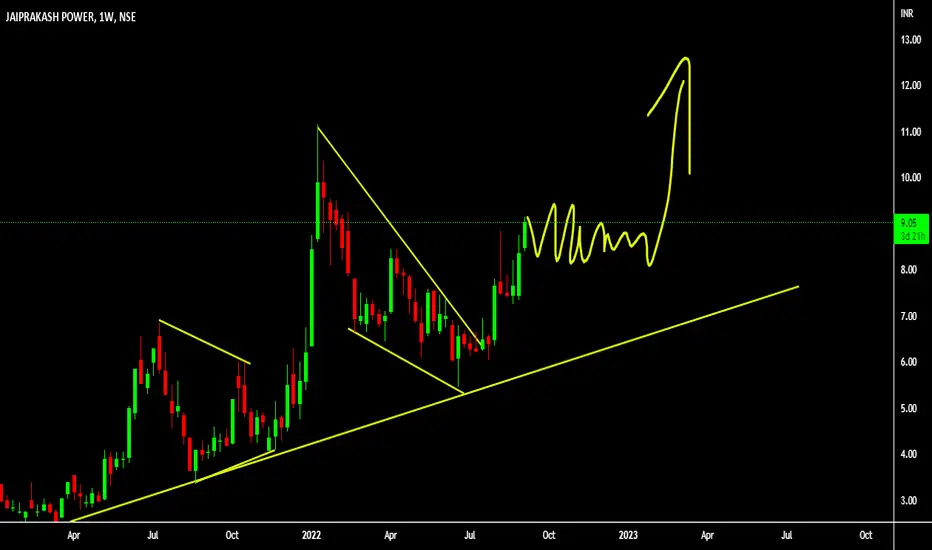
JP Power - Multiyear Breakout ? **JP Power's Potential Multiyear Cup and Handle Formation:** A notable technical pattern is taking shape in JP Power's price chart, known as the "cup and handle." Currently, the pattern is in the "handle" phase, implying a consolidation before a potential breakout. Once the neckline is breached, this could mark the beginning of a significant upward trajectory for JP Power's stock.
**Key Indicators Pointing Towards Strength:** The stock's current situation is characterized by some key indicators. There's a surge in trading volume, reflecting heightened market interest. Furthermore, the Relative Strength Index (RSI) is on the rise, indicating growing price momentum and potential for further gains.
**Anticipating a Positive Price Movement:** The graphical representation of the chart itself provides insights. If the neckline is successfully breached, it could set the stage for a new phase of growth for JP Power. The chart might also suggest potential price targets in the future, with the possibility of the stock potentially surging by over 200% over the course of several years.
**Important Note:** It's essential to underline that this information is not intended as financial advice, but rather for educational purposes. The intricacies of financial markets can be complex, and decisions should be made based on thorough research and consultation with financial professionals.

$JPPOWER investment idea for next 7 to 10 yearsNSE:JPPOWER good investment idea for next 7-10 years.
It is trying to form an inverse H&S
nice RR if we are planning to invest for next 7 to 10 years.
Keeping SL of the recent swing lows
What do you think ?

JPPOWER | BIG OPPORTUNITYJP Power (jppower) appears to present a compelling opportunity for potential investors and traders based on a combination of fundamental and technical factors. The technical analysis suggests that the stock is displaying signs of a potential bullish trend reversal, which is supported by fundamental improvements in the company's performance. Below is a breakdown of the technical analysis:
Fundamental Improvements: The analysis begins by acknowledging significant improvements in the company's fundamentals. These improvements are likely contributing to the positive sentiment surrounding the stock.
Bottom Opportunity: The technical analysis highlights the potential to enter the market at a favorable point, typically referred to as the "bottom." This indicates that the stock might have experienced a recent downtrend and is now positioned for a potential upward move.
Inverted Head and Shoulders Pattern: The technical analysis identifies the formation of an inverted head and shoulders pattern on both the monthly and weekly time frames. This pattern is considered a bullish reversal pattern and suggests that the stock's downtrend might be reversing into an uptrend. The pattern consists of a central low point (the "head") flanked by two higher low points (the "shoulders"). This formation indicates a potential shift from bearish to bullish sentiment.
Trend Line Breakout: The analysis notes that the inverted head and shoulders pattern is accompanied by a breakout from a trend line. This breakout signifies a potential change in the stock's price trajectory and could be indicative of a new uptrend.
Volume Confirmation: The technical analysis highlights that the breakout from the trend line was accompanied by high trading volumes, which surpassed the average volumes observed thus far. Volume is an important confirmation factor in technical analysis, as it adds credibility to price movements and suggests strong market participation.
Weekly Closing Confirmation: The breakout from the trend line also occurred on a weekly basis, and the stock managed to close above this breakout level. Weekly closing prices are often considered more reliable indicators of trend changes compared to intraday or daily price movements.
Price Target: The analysis indicates that the price targets for potential gains are based on the size of the "head" of the inverted head and shoulders pattern. This is a common method to estimate potential price targets in this pattern.
In conclusion, the technical analysis of JP Power (jppower) indicates a multiple confirmation trade opportunity with a bullish bias. The convergence of positive technical factors, including the inverted head and shoulders pattern, trend line breakout, increased volumes, and weekly closing confirmation, suggests that the stock could be poised for an upward move. However, it's important to note that all trading and investment decisions should be made with thorough research and consideration of risk factors.

JPPOWER : Penny stock for long-term/short-mideterm investment#JPPOWER : Jaiprakash Power
Short Term - Midterm Swing Or Long Term stock
Chart Pattern : Rounding Bottom
CMP : 8.15
Safe ENTRY @10.30
Targets : 20, 26, 36
#DYOR

JPPOWER looks bullish on a daily TFIts been making rounding bottom and crawling upwards gradually.
Key level is 9. If it breaks that level with volume, it can reach level 11.
It it follows the trend, we can also see level 18 soon.
Below level 6 it would be weak.

JP POWER Swing and Medium Trend update#JPPOWER
CMP ₹ .8/-
Symmetrical Triangle Pattern Formed
If Break Out Above ₹ 8/- Swing Exit ₹ .10/-
Medium Exit ₹ 17 + + +
Risk Below ₹ . 6/-

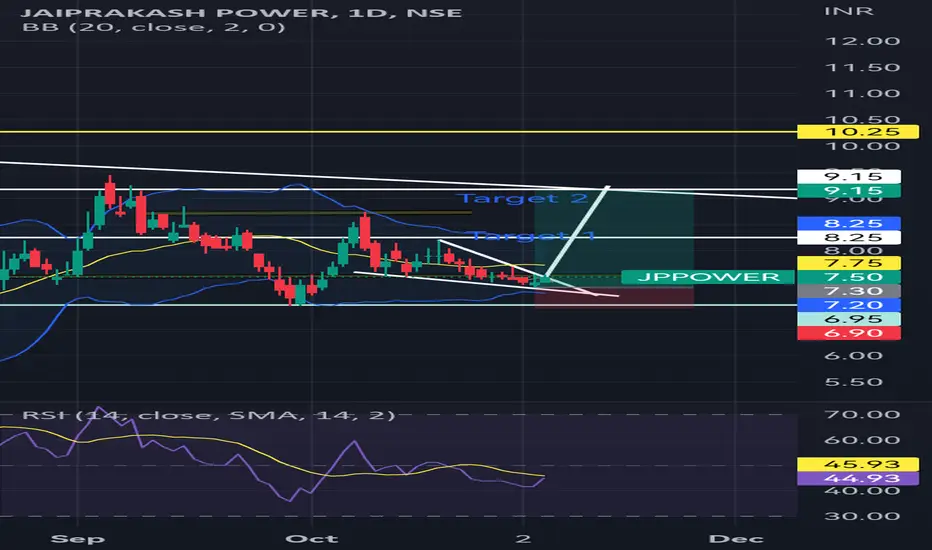
#JPpower seems to be bullish You can buy jppower at the rate of 7.60 with a Stop-loss 6.90 and target 1 8.25 and target 2 9.15 for short-term
This above information is for educational purposes only
JPPOWER Wait for Bulls & Trend ReversalThe idea here is about Jai Prakash Power Ventures:
Jai prakash Power Ventures Ltd. engages in the generation of power. It operates through the following segments: Power and Transmission, Coal, and Other. The Power and Transmission segment includes generation, sale, and transmission of power. The Coal segment refers to the coal mining for captive use in energy generation. The Other segment consists of cement grinding.
My view is short term bearish & long term Bullish for the below observed technical factors.
Points as per TA on a Monthly, Weekly & daily Chart:
1. Contracting or symmetrical triangle formation observed with ABCD completed and expected move towards E on Elliott’s triangle pattern on a weekly chart as per below:
2. Cup & Handle formation observed on a Monthly chart & under ranging market at the time of publishing as per below:
3. Bearish Anti Butterfly Harmonic pattern completed swing target 2: A Swing = 6.45 which is also contracting or symmetrical triangle support zone as per below:
4. Bullish Gartley Harmonic Pattern CD leg in progress, min & max XD distance on Fib is 0.786 for Gartley which is 6.30. Which is also approx to contracting or symmetrical triangle support zone & Target 2 on Bearish Anti Butterfly Harmonic Pattern as per below:
5. Possible Inverse Head & Shoulder Pattern observed & price to be rejected @ 8.50 due to resistance zone & Bearish Anti Butterfly B point on a weekly chart as per below :
6. Elliott’s Bullish triangle ABCD points completed and Price direction towards E point on a weekly chart as per below:
7. Possible Head & Shoulder pattern observed on daily chart with support zone @ 6.75 as per below:
8. Trading way above 20 & 200 EMA on a weekly chart & 20 EMA cross over expected soon.
9. Trading above 200 EMA & 20 EMA Support on weekly chart.
10. Ichimoku Cloud analysis: Kumo Breakout & Kumo Twist on a daily & weekly is strong uptrend & monthly chart is consolidating at the time of publishing.
11. RSI is at 54.17 on a weekly Chart and 49.44 on daily chart at the time of publishing.
12. MACD above signal line on weekly & daily chart, However it is converging towards signal line on weekly chart.
13. Hull Moving average on daily is a sell and other moving averages on weekly & monthly chart is a strong buy.
14. ADX ( Average directional index ) trend strength is at 23.43 on a weekly & 11.70 on daily chart, which indicates a absent or weak trend ( ADX between 0-25 is a Absent or weak trend).
Projected Target with %: Wait for bulls to take over once the price hits 6.60 to 6.45 and enter long since the Risk to Reward looks damn good(Final % provided in chart), since the Earnings report which was on 22nd Oct 2022, looks good this week will give more clarity on Entry points,
Stop Loss: Entry only once we have confirmation for long.
Note: Any dip can be considered as accumulation.
Disclaimer: “The above is an Educational idea only and not any kind of financial or investment advice. So please do your own DD (Due Diligence) before any kind of investment”.
Do you like my TA & ideas!!
Want to keep yourself updated with current market action? Then don’t forget boost & to subscribe for more analysis.
Do leave your valuable feedback & comments for any improvisations.
Cheers.

JP POWER WEEKLY TIME FRAMEThe Structure looks good to us, waiting for this instrument to correct and then give us these opportunities as shown on this instrument (Price Chart).
Note: its my view only and its for educational purpose only. only who has got knowledge about this strategy, will understand what to be done on this setup. its purely based on my technical analysis only (strategies). we don't focus on the short term moves, we look for only for Bullish or Bearish Impulsive moves on the setups after a good price action is formed as per the strategy. we never get into corrective moves. because it will test our patience and also it will be a bullish or a bearish trap. and try trade the big moves.
we do not get into bullish or bearish traps. we anticipate and get into only big bullish or bearish moves (Impulsive moves).
Just ride the bullish or bearish impulsive move. Learn & Know the Complete Market Cycle.
buy low and sell high concept. buy at cheaper price and sell at expensive price.
Keep it simple, keep it Unique.
please keep your comments useful & respectful.
Thanks for your support....
JP power ready for monthly breakoutJP power ready for monthly breakout 1st target is around 40% from here and 2nd target is around 90%

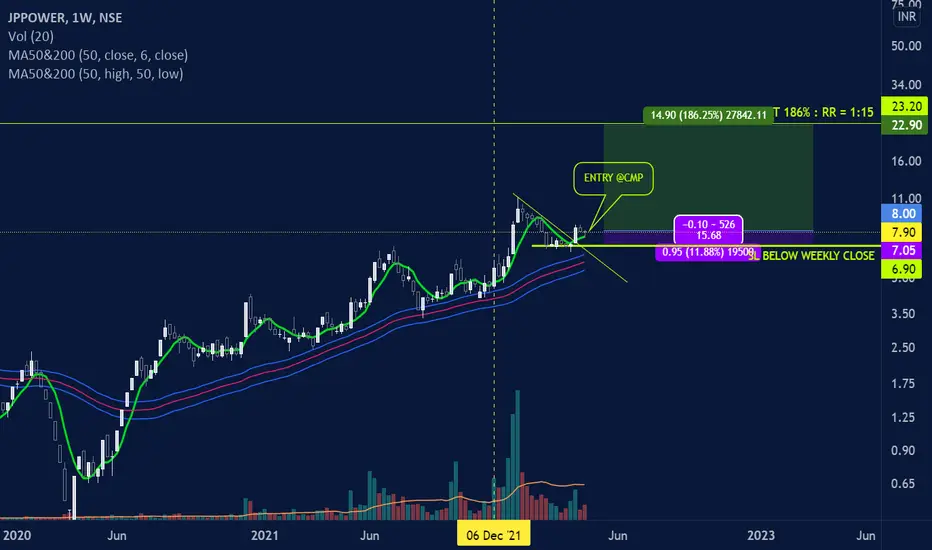
JPPOWER: TARGET 186%; RR = 1:15Hello traders!
JPPOWER breakout confirmation given on last Friday as it closed above the trendline and the 6ma as well. Breakout is supported by the significantly increasing volume in the last two weeks.
Entry can be taken at current market price on Monday with a tiny Stop Loss. Reward is huge as referred to the chart. Go through the chart for better insight of the analysis.
NOTE: Position sizing and risk management is more important than entry.
DISCLAIMER: This analysis is published only for educational purpose and not for trading recommendations.
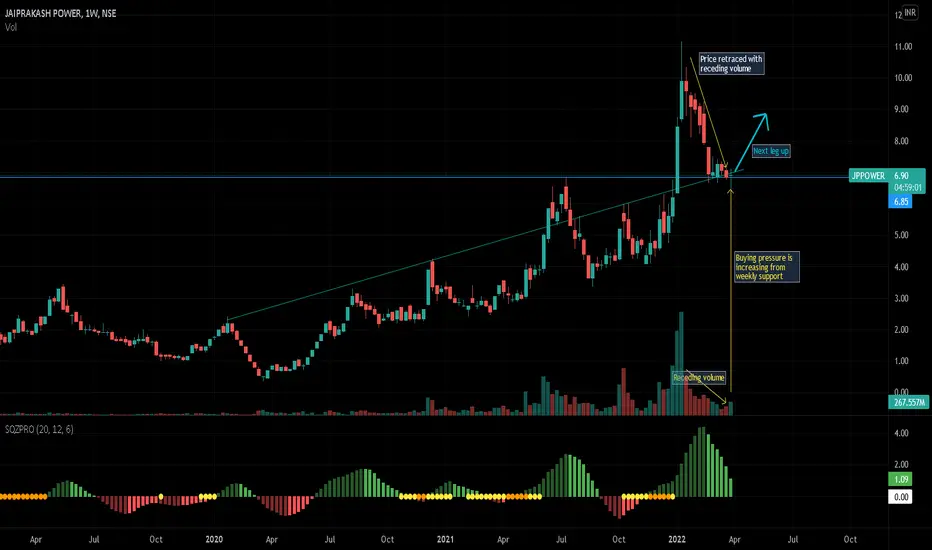
Price Action Analysis of JPPOWERNSE:JPPOWER did a breakout in January 2022. Price retraced back to the weekly support level with receding volume. It's showing signs of reversal as buyers are stepping in and volume is increasing. Price could reverse from here and will continue uptrend.
JppowerI'm headling days of summer cruise fest from Miami to Bahamas June 28- July 1. Super Dope! Book you
Me and #boogie want you to hit us with your #silentridechallenge videos while we finish out this tour.. we'll both be reposting our favourites. Don't embarrass yourself. I'll be watching.
#eminem
Tickets are on sale now for the july 25th show at Cheyenne frontier days ....

JP Power ABOVE 13 . we can get target of 25-26 SL 4
penny stock
eps increased
increase in FII's
small amount can be used in paper trading tp test above 13

Reversal PatternStock Analysis: JP Power buying seen with large volume with stock formed higher high after long consolidation coming days expecting it may move higher for the target given on the chart. Let's see.
Happy Investing!

JAIPRAKASH POWER - JPPOWER(NSE) | BULLISH PENNANTJAIPRAKASH POWER - JPPOWER(NSE) has been forming a Bullish Pennant since a few days. A long candle cutting the pennant upwards can be considered as an intraday buying opportunity. Since the stock is on it's ATH(All Time High), it is hard to determine a target level up to which the price can move, after the breakout. However, performing an Intraday Scalping can give around 0.5% return at-least. Watch out.

JP PowerTrade Setup:
Monthly: Stock has broken out multi-year trend line, with Bullish candle. Huge volumes are accumulated. Crossed 50EMA and sustained (never did before in its lifetime since 2010).
Weekly: change in trend from LH - LL to HH - HL. 50EMA and 200 EMA providing good support. Crossed 200EMA resistance as well (never did before since 2010).
Overall, Good confluences observed, which is very important for a trade.
Entry = CMP ie; 5.20 INR
SL = below support line ie; 3.30 INR
Target = 9.80 INR (T1) and 24 INR (T2)
RR = 2.42 (for T1)
Be patient with the stock. Fundamentals are improving.

JP power-Weekly Cup n handle breakout with VolumesJP Power has given an Weekly Cup n Handle breakout with Bollinger Blast on charts.
Cmp 7.8.
Accumulation zone Rs 7-8
First tgt ts Rs 10 & eventual tgt of rs 13-14.
Stop loss can be placed at Rs 6.5 DCB
Life time highest Weekly Volumes confirms that its a big accumulation. Weekly ADX comfortable abv 25 denotes great strength. MACD also comfortably in Green
Time frame 3-5 weeks for tgt
Regards
Mayank mundra

JP POWER CHART PETTERN CHANNEL
Trade when the channel breaks. Good stock to hold for long term. Check for the levels on channel breakout. Have safe trading

