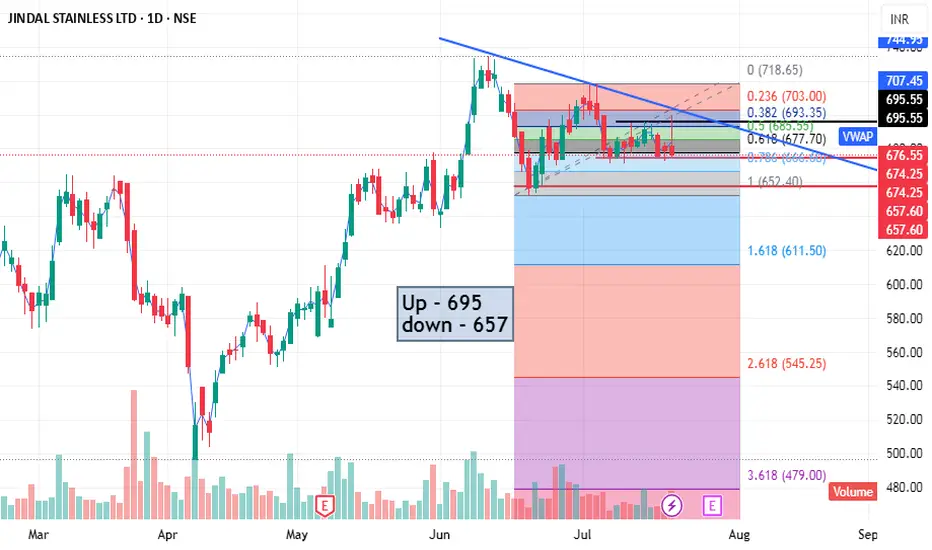
JSL is Shorttime Downside Trend Sharing the chart of JSL in detail research as my opinion trend is Bearish. If closeing basis below 670 then Tg - 657-655, For a shorter time 1 week to 2 weeks
I AM NOT A SEBI REGISTER,
Before invest or trade please consult with financial advisor.
SO This is not TIPS, SUGGESTIONS. Just Sharing m
Next report date
—
Report period
—
EPS estimate
—
Revenue estimate
—
30.45 INR
25.05 B INR
393.12 B INR
259.49 M
About JINDAL STAINLESS LTD
Sector
Industry
CEO
Tarun Kumar Khulbe
Website
Headquarters
New Delhi
Founded
1970
ISIN
INE220G01021
FIGI
BBG000C86T44
Jindal Stainless Ltd. operates as a holding company, which engages in the provision of stainless-steel flat products. Its products include ferro alloys, stainless steel slabs, hot rolled coils, plates and sheets, and cold rolled coils and sheets. The company was founded in 1970 by Om Prakash Jindal and is headquartered in New Delhi, India.
Related stocks
JSL , 1W Pattern is looking soo good and it is ready to Breakout from this pattern ,
do not enter into this until it give a Good Weekly close , if you enter it can be a trap also , so enter after Confirmation and Risk according to your Capital .
Follow for More Swing Ideas Like this

JINDAL STAINLESS Breaks the Channel – What’s Next?After completing a long WXY correction, Jindal Stainless has flipped into a strong uptrend. The price broke above the downtrend channel and also reclaimed the 200-day moving average — confirming strength.
The rally from 504 has unfolded as a nested 1-2, 1-2 impulse, and the wave 5 has now entered i

Jindal stainless ltdJindal Stainless Ltd has been forming higher lows and has now broken through the key resistance level at 660. With this congestion breakout, the stock signals a continued bullish move, potentially heading towards the target of 740.
Please conduct your own technical analysis and apply proper risk ma

Jindal Stainless Ltd Stock Daily AnalysisJindal Stainless Ltd has been forming higher lows and has now broken through the key resistance level at 660. With this congestion breakout, the stock signals a continued bullish move, potentially heading towards the target of 740.
Please conduct your own technical analysis and apply proper risk ma

Review and plan for 6th June 2025 Nifty future and banknifty future analysis and intraday plan.
Positional ideas.
This video is for information/education purpose only. you are 100% responsible for any actions you take by reading/viewing this post.
please consult your financial advisor before taking any action.
----Vinaykumar

JSL ,1DPattern is looking very very good , enter into trade after upper trendline is fully broken with Good Volume with strong candle .
this Metal Sector is Looking Great and Performing very well
Take Risk According to your Capital
Follow for more Swing Ideas Like this .

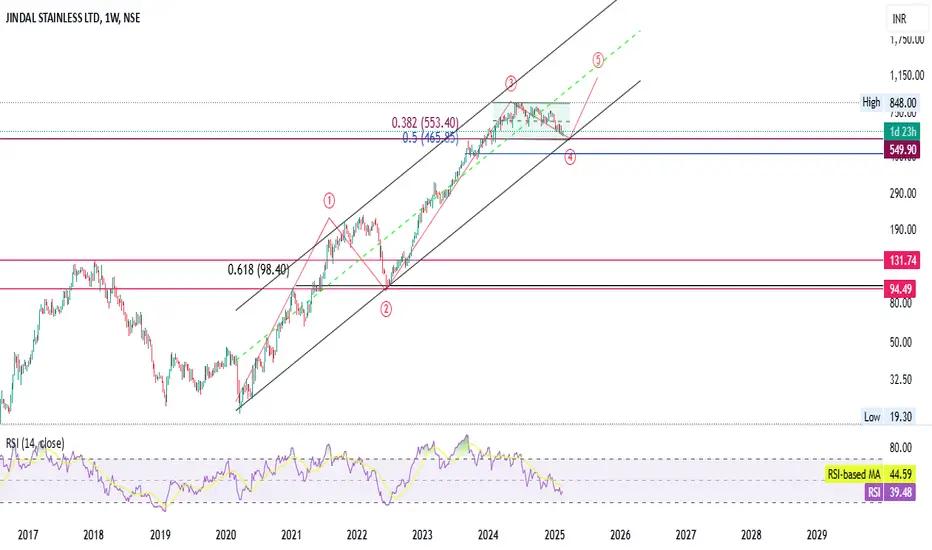
JSL-promoters are showing lot of confidence !This chart represents the weekly price action of Jindal Stainless Ltd. (NSE) with an Elliott Wave analysis and Fibonacci retracement levels. Here's a summary of the key observations:
Technical Analysis Summary:
Elliott Wave Structure:
The stock appears to be in a corrective Wave 4 after completing

JSL- On My shopping list!!Analysis of the Chart (Jindal Stainless Ltd - NSE, Weekly Timeframe)
1. Elliott Wave Structure
Wave (1) and (2) are complete.
Wave (3) reached its peak and Wave (4) is forming, finding support near 549.90 INR (highlighted blue line).
Wave (5) projection: The chart suggests a possible bullish mo
JSL Ascending Triangle
Stock near B.O. At descending line.
Buying Vol. Increasing.
Promoter Holding Increased. JSL overseas holding (subsidiary of JSL) acquire 0.14% in CO. in open market 23-24 dec 2024

See all ideas
Summarizing what the indicators are suggesting.
Neutral
SellBuy
Strong sellStrong buy
Strong sellSellNeutralBuyStrong buy
Neutral
SellBuy
Strong sellStrong buy
Strong sellSellNeutralBuyStrong buy
Neutral
SellBuy
Strong sellStrong buy
Strong sellSellNeutralBuyStrong buy
An aggregate view of professional's ratings.
Neutral
SellBuy
Strong sellStrong buy
Strong sellSellNeutralBuyStrong buy
Neutral
SellBuy
Strong sellStrong buy
Strong sellSellNeutralBuyStrong buy
Neutral
SellBuy
Strong sellStrong buy
Strong sellSellNeutralBuyStrong buy
Displays a symbol's price movements over previous years to identify recurring trends.
Frequently Asked Questions
The current price of JSL is 706.05 INR — it has increased by 1.72% in the past 24 hours. Watch JINDAL STAINLESS LTD stock price performance more closely on the chart.
Depending on the exchange, the stock ticker may vary. For instance, on NSE exchange JINDAL STAINLESS LTD stocks are traded under the ticker JSL.
JSL stock has risen by 6.30% compared to the previous week, the month change is a −0.27% fall, over the last year JINDAL STAINLESS LTD has showed a −4.90% decrease.
We've gathered analysts' opinions on JINDAL STAINLESS LTD future price: according to them, JSL price has a max estimate of 810.00 INR and a min estimate of 675.00 INR. Watch JSL chart and read a more detailed JINDAL STAINLESS LTD stock forecast: see what analysts think of JINDAL STAINLESS LTD and suggest that you do with its stocks.
JSL stock is 3.81% volatile and has beta coefficient of 1.58. Track JINDAL STAINLESS LTD stock price on the chart and check out the list of the most volatile stocks — is JINDAL STAINLESS LTD there?
Today JINDAL STAINLESS LTD has the market capitalization of 581.62 B, it has decreased by −0.74% over the last week.
Yes, you can track JINDAL STAINLESS LTD financials in yearly and quarterly reports right on TradingView.
JINDAL STAINLESS LTD is going to release the next earnings report on Aug 6, 2025. Keep track of upcoming events with our Earnings Calendar.
JINDAL STAINLESS LTD revenue for the last quarter amounts to 101.98 B INR, despite the estimated figure of 103.06 B INR. In the next quarter, revenue is expected to reach 104.45 B INR.
JSL net income for the last quarter is 5.91 B INR, while the quarter before that showed 6.55 B INR of net income which accounts for −9.75% change. Track more JINDAL STAINLESS LTD financial stats to get the full picture.
EBITDA measures a company's operating performance, its growth signifies an improvement in the efficiency of a company. JINDAL STAINLESS LTD EBITDA is 46.67 B INR, and current EBITDA margin is 11.87%. See more stats in JINDAL STAINLESS LTD financial statements.
Like other stocks, JSL shares are traded on stock exchanges, e.g. Nasdaq, Nyse, Euronext, and the easiest way to buy them is through an online stock broker. To do this, you need to open an account and follow a broker's procedures, then start trading. You can trade JINDAL STAINLESS LTD stock right from TradingView charts — choose your broker and connect to your account.
Investing in stocks requires a comprehensive research: you should carefully study all the available data, e.g. company's financials, related news, and its technical analysis. So JINDAL STAINLESS LTD technincal analysis shows the strong buy rating today, and its 1 week rating is strong buy. Since market conditions are prone to changes, it's worth looking a bit further into the future — according to the 1 month rating JINDAL STAINLESS LTD stock shows the buy signal. See more of JINDAL STAINLESS LTD technicals for a more comprehensive analysis.
If you're still not sure, try looking for inspiration in our curated watchlists.
If you're still not sure, try looking for inspiration in our curated watchlists.