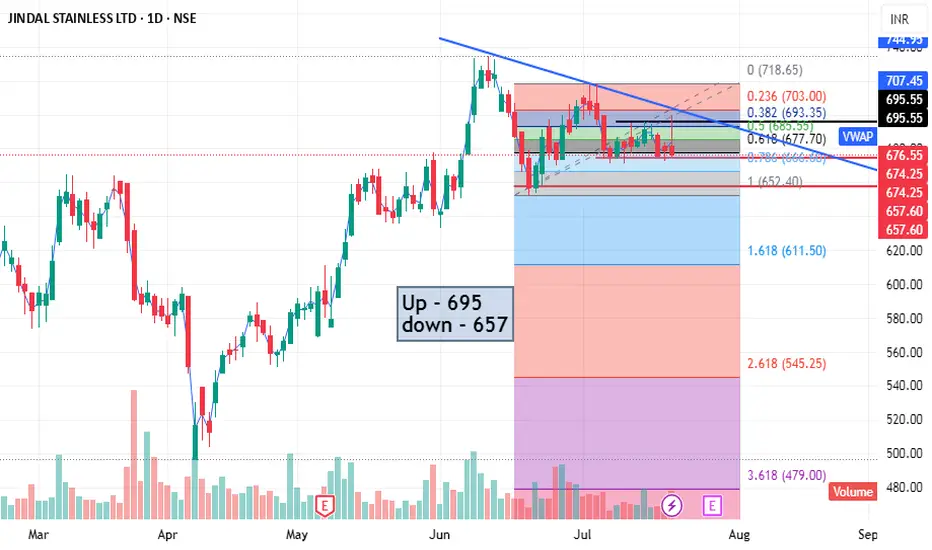
JSL is Shorttime Downside Trend Sharing the chart of JSL in detail research as my opinion trend is Bearish. If closeing basis below 670 then Tg - 657-655, For a shorter time 1 week to 2 weeks
I AM NOT A SEBI REGISTER,
Before invest or trade please consult with financial advisor.
SO This is not TIPS, SUGGESTIONS. Just Sharing my Experience.
JSL trade ideas
JSL , 1W Pattern is looking soo good and it is ready to Breakout from this pattern ,
do not enter into this until it give a Good Weekly close , if you enter it can be a trap also , so enter after Confirmation and Risk according to your Capital .
Follow for More Swing Ideas Like this

JINDAL STAINLESS Breaks the Channel – What’s Next?After completing a long WXY correction, Jindal Stainless has flipped into a strong uptrend. The price broke above the downtrend channel and also reclaimed the 200-day moving average — confirming strength.
The rally from 504 has unfolded as a nested 1-2, 1-2 impulse, and the wave 5 has now entered its 1 to 1.618 projection zone. We’re likely entering a blue Wave 4 pullback, especially as:
RSI shows bearish divergence
The rally looks stretched short-term
A healthy retracement toward the 661–640 zone can follow.
As long as 633.35 holds, this bullish structure remains intact.
Trend : Bullish
Retracement zone : 661.80 – 640.65
Invalidation : Below 633.35
This is a dynamic setup. Chart will be updated as price action unfolds
Disclaimer: This analysis is for educational purposes only and does not constitute investment advice. Please do your own research (DYOR) before making any trading decisions.

Jindal stainless ltdJindal Stainless Ltd has been forming higher lows and has now broken through the key resistance level at 660. With this congestion breakout, the stock signals a continued bullish move, potentially heading towards the target of 740.
Please conduct your own technical analysis and apply proper risk management before taking any trade. This is solely my personal view.
#jsl #bestbreakout #uptrend #longteam

Jindal Stainless Ltd Stock Daily AnalysisJindal Stainless Ltd has been forming higher lows and has now broken through the key resistance level at 660. With this congestion breakout, the stock signals a continued bullish move, potentially heading towards the target of 740.
Please conduct your own technical analysis and apply proper risk management before taking any trade. This is solely my personal view.

Review and plan for 6th June 2025 Nifty future and banknifty future analysis and intraday plan.
Positional ideas.
This video is for information/education purpose only. you are 100% responsible for any actions you take by reading/viewing this post.
please consult your financial advisor before taking any action.
----Vinaykumar hiremath, CMT

JSL ,1DPattern is looking very very good , enter into trade after upper trendline is fully broken with Good Volume with strong candle .
this Metal Sector is Looking Great and Performing very well
Take Risk According to your Capital
Follow for more Swing Ideas Like this .

JSL-promoters are showing lot of confidence !This chart represents the weekly price action of Jindal Stainless Ltd. (NSE) with an Elliott Wave analysis and Fibonacci retracement levels. Here's a summary of the key observations:
Technical Analysis Summary:
Elliott Wave Structure:
The stock appears to be in a corrective Wave 4 after completing an impulsive Wave 3.
A potential Wave 5 uptrend is anticipated, as per the Elliott Wave structure.
Fibonacci Retracement Levels:
The price has retraced close to the 0.5 Fibonacci level (465.85), which is a strong support zone.
The 0.382 level (553.40) is also a critical resistance, which the price is testing.
RSI Analysis (Relative Strength Index):
RSI is at 40.26, indicating that the stock is approaching the oversold region.
The RSI moving average (44.12) is slightly above the RSI value, suggesting weak momentum.
Support & Resistance:
Support levels: ~465.85 and ~549.90.
Resistance levels: Previous high near 848.00.
Possible Future Movement:
If Wave 4 completes, a bullish reversal for Wave 5 could take the stock higher.
A further breakdown below 465.85 might invalidate the bullish scenario.
Conclusion:
The stock is in a correction phase, but signs of reversal are emerging.
Watch for price action near the 549.90 support zone and RSI movement above 50 for confirmation of bullish momentum.
If bullish Wave 5 starts, the stock may target new highs.

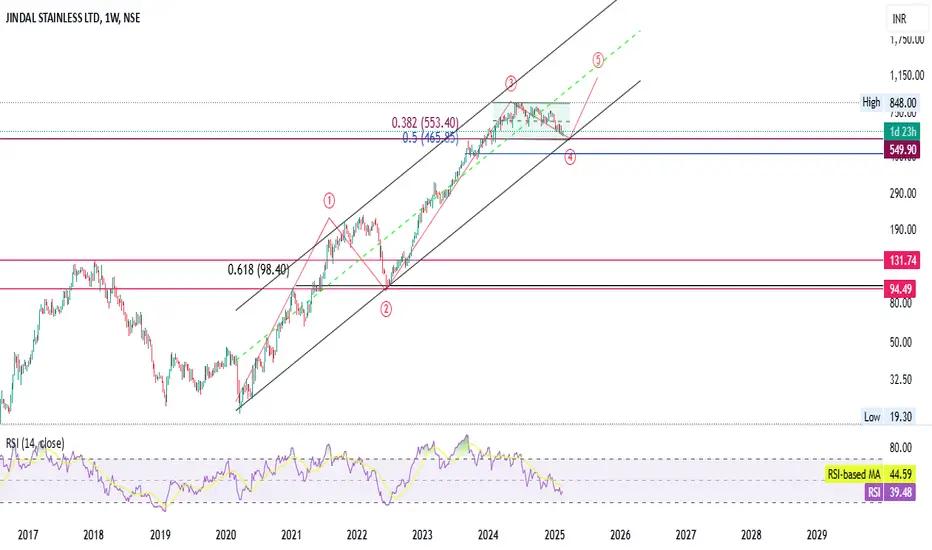
JSL- On My shopping list!!Analysis of the Chart (Jindal Stainless Ltd - NSE, Weekly Timeframe)
1. Elliott Wave Structure
Wave (1) and (2) are complete.
Wave (3) reached its peak and Wave (4) is forming, finding support near 549.90 INR (highlighted blue line).
Wave (5) projection: The chart suggests a possible bullish move from Wave (4) to Wave (5), targeting new highs.
2. Fibonacci Retracement Levels
0.382 (553.40 INR) and 0.5 (465.85 INR) are key Fibonacci levels.
Current support: The stock is bouncing from the 0.382 Fibonacci retracement level, indicating a potential reversal zone.
If this level fails, the next major support is near 465 INR (0.5 level).
3. Price Action & Trendline Support
The stock has been following an ascending channel, touching both the upper and lower trendlines.
Currently, the price is near the lower boundary of the channel, which historically has acted as a strong support.
A breakout above the mid-line of the channel could trigger Wave (5) rally.
4. RSI (Relative Strength Index)
The RSI is 39.48, indicating mildly oversold conditions.
The RSI-based moving average is 44.59, showing weakness but also potential for reversal.
If RSI crosses above 50, it could signal bullish momentum.
5. Key Levels to Watch
Immediate Support: 549.90 INR (current bounce level)
Major Support: 465.85 INR (0.5 Fibonacci level)
Resistance Levels:
605-610 INR (recent highs)
848 INR (previous peak & target for Wave 5)
Conclusion
✅ Bullish Scenario: If the price holds 549 INR support and RSI improves, a potential Wave 5 rally could push the stock towards 700-850 INR in the coming months.
❌ Bearish Scenario: A breakdown below 465 INR could signal further downside towards 350-400 INR.
JSL Ascending Triangle
Stock near B.O. At descending line.
Buying Vol. Increasing.
Promoter Holding Increased. JSL overseas holding (subsidiary of JSL) acquire 0.14% in CO. in open market 23-24 dec 2024

JSL LONGIf JSL comes down 670-690 will be act as a order block
JSL enter this level then we go for a long
target will be T1= 770
T2 = 850
let's see ....

Jindal stainless steel-Bullish Swing- Is this reversal signal???
12.08.2024
Buy 694
Target 807
Stop Loss 616
Risk Reward- 1:1.5
1. Inside bar breakout
2. Price rejection from both parallel and horizontal support zone
3. Double bottom formation.
4. RSI from over sold to normal bullish level(40)
5. Good increasing volumes in bullish movement
6. Price rejection from 0.618 Fibonacci level
7. 200 EMA Rejection
NSE:JINDALSTEL

JSL S/RSupport and Resistance Levels:
Support Levels: These are price points (green line/shade) where a downward trend may be halted due to a concentration of buying interest. Imagine them as a safety net where buyers step in, preventing further decline.
Resistance Levels: Conversely, resistance levels (red line/shade) are where upward trends might stall due to increased selling interest. They act like a ceiling where sellers come in to push prices down.
Breakouts:
Bullish Breakout: When the price moves above resistance, it often indicates strong buying interest and the potential for a continued uptrend. Traders may view this as a signal to buy or hold.
Bearish Breakout: When the price falls below support, it can signal strong selling interest and the potential for a continued downtrend. Traders might see this as a cue to sell or avoid buying.
20 EMA (Exponential Moving Average):
Above 20 EMA: If the stock price is above the 20 EMA, it suggests a potential uptrend or bullish momentum.
Below 20 EMA: If the stock price is below the 20 EMA, it indicates a potential downtrend or bearish momentum.
Trendline: A trendline is a straight line drawn on a chart to represent the general direction of a data point set.
Uptrend Line: Drawn by connecting the lows in an upward trend. Indicates that the price is moving higher over time. Acts as a support level, where prices tend to bounce upward.
Downtrend Line: Drawn by connecting the highs in a downward trend. Indicates that the price is moving lower over time. It acts as a resistance level, where prices tend to drop.
RSI: RSI readings greater than the 70 level are overbought territory, and RSI readings lower than the 30 level are considered oversold territory.
Combining RSI with Support and Resistance:
Support Level: This is a price level where a stock tends to find buying interest, preventing it from falling further. If RSI is showing an oversold condition (below 30) and the price is near or at a strong support level, it could be a good buy signal.
Resistance Level: This is a price level where a stock tends to find selling interest, preventing it from rising further. If RSI is showing an overbought condition (above 70) and the price is near or at a strong resistance level, it could be a signal to sell or short the asset.
Disclaimer:
I am not a SEBI registered. The information provided here is for learning purposes only and should not be interpreted as financial advice. Consider the broader market context and consult with a qualified financial advisor before making investment decisions.

JSL 1DI expect the price might reach ₹840
I'm not a SEBI-registered analyst. All posts and levels shared are just for educational purposes. I'm not responsible for any losses or profits. No claims, all rights reserved

LONG: Jindal Stainless - Double Bottom Reversal- 21% UpsideLong Position:
Double Bottom Pattern: Jindal Stainless has formed a classic double bottom around the 640-650 range, indicating a potential bullish reversal. The key level to watch is the neckline resistance around 890-900. A breakout above this level could lead to further upside.
Entry: Current price level (around 733-735)
Target: 890-900 (Neckline of the double bottom)
Stop-Loss: 700-710 (Tight stop-loss below recent consolidation)
Time Frame: ~1.5 months (Expected to reach the target within this period based on pattern development)
MACD Bullish Crossover: The MACD has crossed into bullish territory, suggesting that momentum is on the upside.
Bollinger Bands: The stock is currently near the middle of the Bollinger Bands, providing room for a move towards the upper band, aligning with the potential target.
Risk/Reward Ratio: ~3:1
Potential Upside: ~21% (from current levels to the 890-900 target range)
Strategy:
Enter long at the current price level with a target of 890-900, where the neckline of the double bottom lies. Use a stop-loss at 700-710 to minimize downside risk.
Key Levels to Watch:
Support: 700-710 (Stop-loss level)
Resistance: 890-900 (Neckline and target level)
Disclaimer:
*I am not SEBI registered and this idea could be wrong. I'm here to learn, so please share your thoughts in the comments. Don’t follow this blindly! :) *

Jindal Stainless LimitedNext Big move on Jindal Stainless Limited
For Longs as price is at the extreme order block, Rejected at order block with fair value gap, Wait for the trend line brake with volume. take a lower time frame long entry to increase risk to reward ratio..

JSL - A guide to Uptrend stock readingThe chart shows how to interpret candles along with volumes. It also shows the explanation of consolidation after an uptrend.
This chart is only for educational purpose. Please consult your financial advisor before taking any decisions for investments

JINDAL STANLES GIVES BRAKEOUT ON DAILY CHARTNSE:JSL
JINDAL STANELESS GIVES BRAKEOUT ON DAILY CHART
buy 800
Sl 745
Target 940+
time 1-2 month


Jindal Stainless Ltd Above All Time Breakout Jindal Stainless Ltd Above All Time Breakout
Buy Above 550
Stoploss bello 455
Targel Near 700-750
Holding Time 2-3 Month
Disclosure : I am not SEBI registered.The information provided here is for education purposes only.I will not be responsible for any of your profit/loss with this channel suggestions.Consult your financial advisor before taking any decisions.

Looks good for long term as well as short termIn 2024 it can touch 700 levels. Ready to breakout its consolidation zone.

JSL looks bullish on a daily time frameJSL looks bullish and has been in an uptrend for a while. It has just reversed RSI from 40 on a daily time frame. RSI above 60 on weekly and monthly time frames. The volume has increased significantly in the last trading session. The price has just crossed the trend line but retraced back. It would be a good buy if the price breaks 480 levels with fair volume & retest it. We can achieve 1:3 risk-to-reward ratio. It may give a break out if trending upward. It will become weak below 440 levels.

JSLNSE:JSL
LIFE TIME BO!!!
One Can Enter Now ! Or Wait for Retest of the Trendline (BO) Or wait For better R:R ratio
Note :
1.One Can Go long with a Strict SL below the Trendline or Swing Low of Daily Candle.
2. Close, should be good and Clean.
3. R:R ratio should be 1 :2 minimum
4. Plan as per your RISK appetite
Disclaimer : You are responsible for your Profits and loss, Shared for Educational purpose
