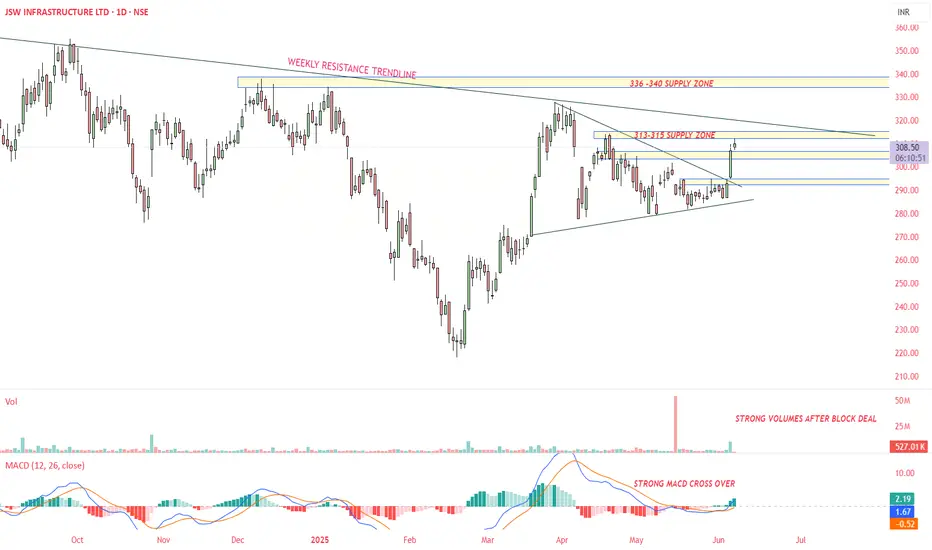
JSWINFRA - Daily time frame StudyFollowing are my Inputs for above chart reading -
1. MACD cross over
2. High volume Breakout of Symmetrical Triangle Pattern - Daily Time frame
3. It may go till weekly resistance line 330-340
This chart is only for educational purpose, Please contact your financial advisor for any trading or investment decisions.
JSWINFRA trade ideas
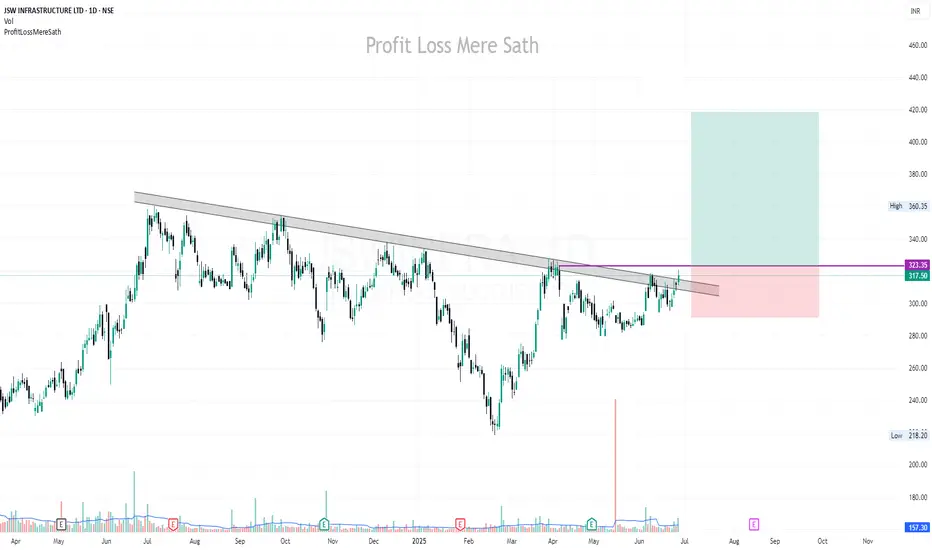
JSWINFRA | Buy Above 324 | SL Below 290 | Target 417Disclaimer:
This is not financial advice. Please do your own research or consult with a financial advisor before making any investment decisions. Investments in stocks can be risky and may result in loss of capital.

Jsw Infra , 1WExpansion Channel is looking good , it is consolidating from One Year
Now it is ready to Breakout , wait for proper breakout to Happen
wait for string close above trendline
Follow for more Swing Ideas Like This

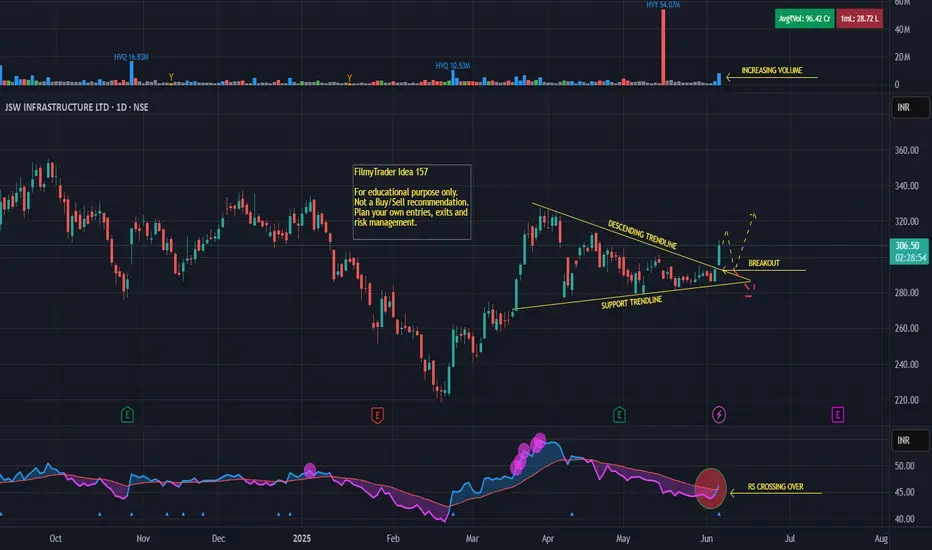
JSWINFRA - Triangle BreakoutJSW INFRASTRUCTURE LTD
Breakout from a triangle pattern on daily timeframe.
High trade and delivery quantity.
Increasing relative strength.
Disclaimer:
For educational purpose only.
Please do your own research before taking any trades.
Happy Trading!
JSW Infra Set to Rise After Strong Results and Key Support..!JSW Infrastructure has released its financial results for the December quarter, showcasing a remarkable 32.35 percent surge in consolidated net profit, reaching an impressive Rs 335.62 crore. This substantial increase marks a significant rise from Rs 253.57 crore in the same quarter last year, fueled by a notable boost in income, as highlighted in the company's official statement.
Looking at the technical chart, the stock is currently positioned at a critical support level of Rs 260. It is making a determined effort to hold above this threshold, indicating a potential opportunity for investors. Given this scenario, traders might consider taking long positions or executing a buying strategy for swing trading, as a sustained performance above this level could signal further upward momentum.

JSWINFRA Weekly InvestingBuy when CLOSE between 322 -334
Stoploss - 307
Target Price : 358
Reward: Risk - 2:1
% Profit : 10%
Disclaimer:
I am not a SEBI registered. The information provided here is for learning purposes only and should not be interpreted as financial advice. Consider the broader market context and consult with a qualified financial advisor before making investment decisions.

JSW INFRASTRUCTURE LTD S/RSupport and Resistance Levels:
Support Levels: These are price points (green line/shade) where a downward trend may be halted due to a concentration of buying interest. Imagine them as a safety net where buyers step in, preventing further decline.
Resistance Levels: Conversely, resistance levels (red line/shade) are where upward trends might stall due to increased selling interest. They act like a ceiling where sellers come in to push prices down.
Breakouts:
Bullish Breakout: When the price moves above resistance, it often indicates strong buying interest and the potential for a continued uptrend. Traders may view this as a signal to buy or hold.
Bearish Breakout: When the price falls below support, it can signal strong selling interest and the potential for a continued downtrend. Traders might see this as a cue to sell or avoid buying.
MA Ribbon (EMA 20, EMA 50, EMA 100, EMA 200) :
Above EMA: If the stock price is above the EMA, it suggests a potential uptrend or bullish momentum.
Below EMA: If the stock price is below the EMA, it indicates a potential downtrend or bearish momentum.
Trendline: A trendline is a straight line drawn on a chart to represent the general direction of a data point set.
Uptrend Line: Drawn by connecting the lows in an upward trend. Indicates that the price is moving higher over time. Acts as a support level, where prices tend to bounce upward.
Downtrend Line: Drawn by connecting the highs in a downward trend. Indicates that the price is moving lower over time. It acts as a resistance level, where prices tend to drop.
Disclaimer:
I am not a SEBI registered. The information provided here is for learning purposes only and should not be interpreted as financial advice. Consider the broader market context and consult with a qualified financial advisor before making investment decisions.

JSWINFRA making waves!!!A bull flag formation!
Support from 100ema and 200ema!
FII's are too getting into the stock!
Long in it!

JSWINFRA chart analysisJSWINFRA chart analysis on daily timeframe. It looks like this stock has taken support and ready to move towards its nearest resistance.
Please share your feedback and follow for more such charts.

JSWINFRA - 15 week time cycleJSWINFRA is playing out its relatively short 15 week time cycle a new rally has just begin, good time to enter

JSWINFRALooks Supergood on Charts.
Near All Time High.
Above all Key EMA.
Good for Shortterm.
Do Like ,Comment , Follow for regular Updates...
Keep Learning ,Keep Earning...
Disclaimer : This is not a Buy or Sell recommendation. I am not SEBI Registered. Please consult your financial advisor before making any investments . This is for Educational purpose only.

GO LONG JSWINFRACMP: 220;
NEAR TERM TARGET: 240-245
RSI:52.76
SL:210
4W SUPPORT ZONE:175
Disclaimer: This written/visual material is comprised of personal opinions and ideas. The content should not be construed as containing any type of investment advice and/or a solicitation for any transactions. It does not imply an obligation to purchase investment services, nor does it guarantee or predict future performance


JSW INFRA - SHORT TERM & LONG TERM SEEMS GOODCan enter at CMP 224
If falls again you need to average at 200 level
Targets - 245,280+
Disclaimer - All information on this page is for educational purposes only,
we are not SEBI Registered, Please consult a SEBI registered financial advisor for your financial matters before investing And taking any decision. We are not responsible for any profit/loss you made.
Request your support and engagement by liking and commenting & follow to provide encouragement
HAPPY TRADING 👍

$jswinfracoming down for a retest
cut if it closes below buy as close to it as possible
not much history to go by but recon we carry on up
