Kansai Nerolac 1 d chart Lower low formations halted
Making double bottom with reversal candlestick signals .
Volume greater than 20 MA
KANSAINER trade ideas

Kansai Nerolac LONGKansai Nerolac
MTF Analysis
Kansai NerolacYearly Demand BUFL 270
Kansai Nerolac 6 Month Demand BUFL 270
Kansai NerolacQtrly Demand Breakout 256
Kansai NerolacMonthly Demand 250
Kansai NerolacWeekly Demand 276.4
Kansai NerolacDaily Demand DMIP 276.4
ENTRY -1 276
SL 266
RISK 10
Potential Target 440
First Target Points 353
First recovery Target Points 87
Last Swing Low 266
Last Swing High 353
RR 8
RR 59%

Darvas Box Strategy - Breakout StockDisclaimer: I am Not SEBI Registered adviser, please take advise from your financial adviser before investing in any stocks. Idea here shared is for education purpose only.
Stock has given break out. Buy above high. Keep this stock in watch list.
Buy above the High and do not forget to keep stop loss, best suitable for swing trading.
Target and Stop loss Shown on Chart. Risk to Reward Ratio/ Target Ratio 1:2.
Stop loss can be Trail when it make new box.
Be Discipline, because discipline is the key to Success in Stock Market.
Trade what you See Not what you Think.

KANSAI NEROLAC: No, its not going to listen to crude priceKANSAI NEROLAC:
A Paint Company. Many factors depends on the profitability of this company.
But..but.... Now it seems no factors affect its price, its going to break ATH...

KANSAINER go long ifit crosses 287.50
entry price: 287.55
stop loss: 264.90(risk of 7.88%)
target: 330.80 (reward of 15.74% with risk of 7.88%)
Please invest only if one is capable of taking risk of 7.88% if it falls
I am not a SEBI registered individual , this is my personal trade idea and i am investing in it with proper risk management, please take advise from your financial advisor before investing into it.

KANSAINER Buy Setup"Super valid-looking! Leave a comment if you like my entry setup. This share is for educational learning purposes only, and I am not responsible for your profit or loss. Note: For more details, check the chart."

KANSAINER - Weekly AnalysisIn the Weekly Chart of KANSAINER ,
we can see that, it is at decision making point.
lets see whether it makes or breaks.

Flag & Pole - Keep a WatchFlag & Pole - Keep a Watch , Good Fundamentals as well. Too Lazy to write more :)
KANSAI NEROLAC BULLISHKansai Nerolac paint is looking strong for possible upside. Stock has given breakout with huge volumes. On upside minor resistance is there. Stock could be retraced. It has challenged bollinger band on upside.
Monthly MACD has given uptick.
Weekly macd positive crossover.
Daily macd positive crossover stat.


KANSAI NEROLAC PAINTS (LONG)support zone at 521-532-545
as of now at resistance at 597
if this resistance crossed and retested tgt is 673 which is also a breakout level.
if it falls back from 597 facing resistance .. expected tgt for short is 545 - 532 - 521.
Must Correlate yourself also on charts before taking an entry. This is for Educational purposes only. Please consult your Financial advisor before investing.

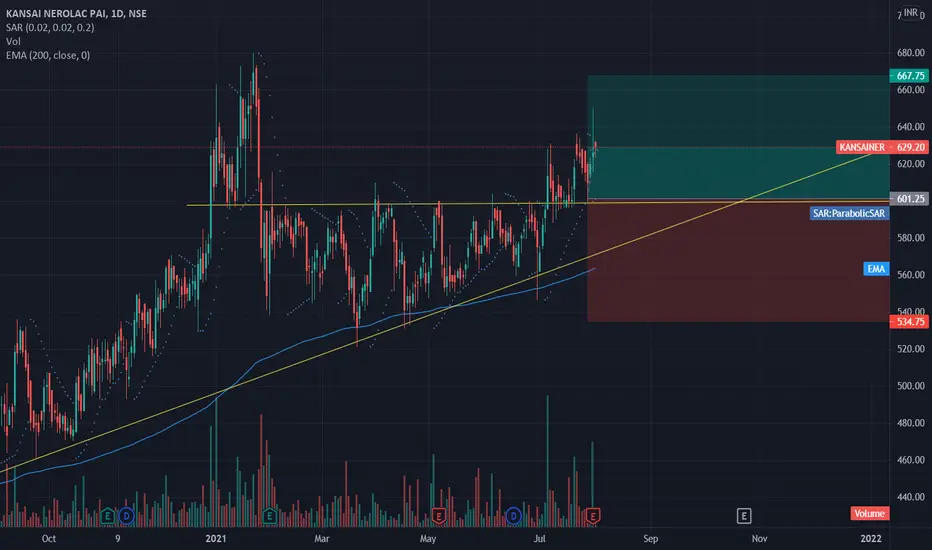
KansaiNerolac Short Term Breakout TradeThe stock has broken out and took a support at the previously upper trendline. Trade is supported by brokerage calls and Supports Nearby including 200 EMA .
The stock has previously broken out with good volumes and has retested the upper trendline which is the point of entry.
Risk Reward Ratio - 1:1.
SL is placed below multiple major support zone , 200 EMA and previously Lower Trendline and target is place near all time high.
Kansai Nerolac BreakoutThe stock has broken out and retested, so it may undergo a rally. Trade is supported by brokerage calls and Supports Nearby.
Risk Reward Ratio - 2:1
SL is placed below support zone & the previously upper trendline. The target is placed based on fundamentals and near swing high.

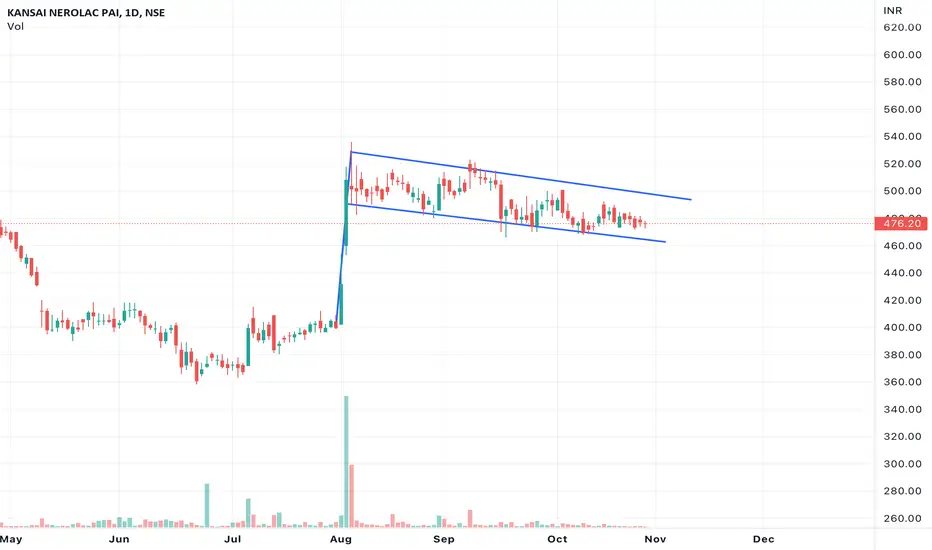
Breaking Wedge PatternKansainer has broken the wedge pattern and price broke consolidation area it is good buy around immediate demand zone and below demand zone for stop loss level for the target given on the chart..
Lets see
Happy investing!
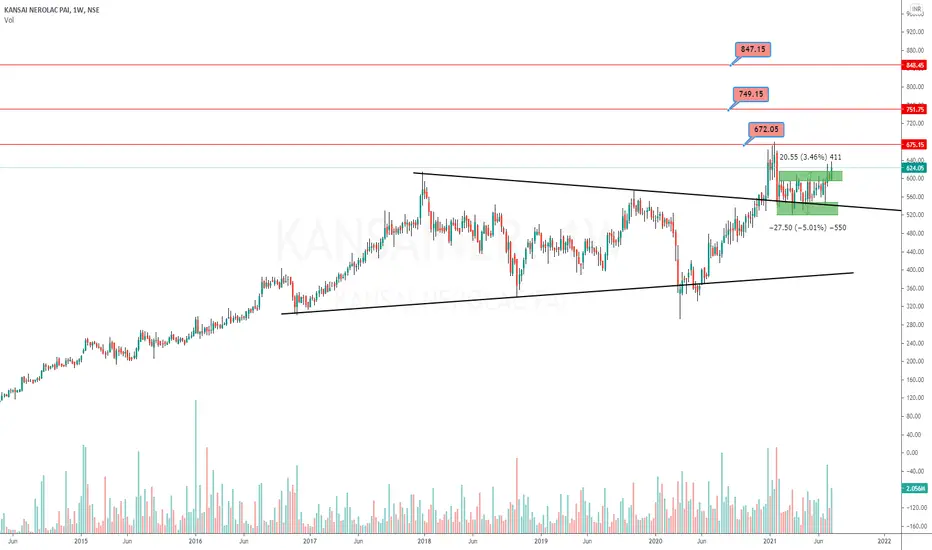
KANSAI NEROLAC - Picking momentumThe stock has been moving sideways for the past many months ( approx 8 months).
Current price action, suggesting that the stock is trying to pick up the momentum on the upside.
The stock has created strong support around 530-550 levels.
Hence sustaining these supports, stock could move towards 750 and 900 in the coming months.
Considering the history of the stocks, am not expecting a fast movement, it will move slowly and could also test your patience.
The analysis will remain the same as long it is trading above 500 levels.
Buy on dips for me, please do your own analysis, before trading/investing in the stock.
Trade Type : Positional
SL: Below 500
Share it with others, if you find it informative


Breakout and retestA good Breakout and Retest trade which has a lot changes of being successfull. Easy 10% with low risk. Better RR.


KANSAINER --- Going to Breakout Looking Bullish ....
Currently stock at edge of breakout ...
SL is 560 and target 605..
