KELLTON TECH SOL LTD S/RSupport and Resistance Levels:
Support Levels: These are price points (green line/shade) where a downward trend may be halted due to a concentration of buying interest. Imagine them as a safety net where buyers step in, preventing further decline.
Resistance Levels: Conversely, resistance levels (red line/shade) are where upward trends might stall due to increased selling interest. They act like a ceiling where sellers come in to push prices down.
Breakouts:
Bullish Breakout: When the price moves above resistance, it often indicates strong buying interest and the potential for a continued uptrend. Traders may view this as a signal to buy or hold.
Bearish Breakout: When the price falls below support, it can signal strong selling interest and the potential for a continued downtrend. Traders might see this as a cue to sell or avoid buying.
MA Ribbon (EMA 20, EMA 50, EMA 100, EMA 200) :
Above EMA: If the stock price is above the EMA, it suggests a potential uptrend or bullish momentum.
Below EMA: If the stock price is below the EMA, it indicates a potential downtrend or bearish momentum.
Trendline: A trendline is a straight line drawn on a chart to represent the general direction of a data point set.
Uptrend Line: Drawn by connecting the lows in an upward trend. Indicates that the price is moving higher over time. Acts as a support level, where prices tend to bounce upward.
Downtrend Line: Drawn by connecting the highs in a downward trend. Indicates that the price is moving lower over time. It acts as a resistance level, where prices tend to drop.
Disclaimer:
I am not a SEBI registered. The information provided here is for learning purposes only and should not be interpreted as financial advice. Consider the broader market context and consult with a qualified financial advisor before making investment decisions.
KELLTONTEC trade ideas


BullishResistance Level: Around INR 158.31, the stock reached this point and faced rejection, indicating a strong resistance. If it breaks above this level, it could continue upward.
Support Levels:
Support-3: INR 123.08 – the nearest support level. It should hold if the stock pulls back.
Support-2: INR 86.73 – a significant level that might be tested if the price breaks below Support-3.
Support-1: INR 40.95 – a major support level, signaling a strong buying zone.
Channel Pattern: The chart shows an upward channel indicating a bullish trend. If the stock remains within the channel, the trend remains intact.
Ideas:
A breakout above the resistance could signal further upward movement.
If the price falls, it may test the support levels.
Watch for any candlestick patterns or volume spikes at key levels for signs of reversal or continuation.

50 SMA Rising - Positional TradeDisclaimer: I am not a Sebi registered adviser.
This Idea is publish purely for educational purpose only before investing in any stocks please take advise from your financial adviser.
It 50 SMA Rising. Suitable for Positional Trading Initial Stop loss lowest of last 2 candles and keep trailing with 50 days SMA if price close below 50 SMA then Exit or be in the trade some time trade can go for several months.
Be Discipline because discipline is the Key to Success in the STOCK Market.
Trade What you see not what you Think

Kelltontech solution breaks it's all time previous high It means there is something big going to happen in this stock

SWING IDEA - KELLTON TECH SOLUTIONSKellton Tech, a global IT services and digital transformation solutions provider, is showing technical signals that suggest a promising swing trading opportunity.
Reasons are listed below :
Attempt to Break Cup and Handle Pattern : The price is attempting to break out of a classic cup and handle pattern, which is a bullish continuation pattern indicating potential for further upward movement.
115-125 Resistance Zone : The 115-125 level has been a significant resistance zone, tested multiple times. The price is now trying to break through this level, suggesting strong bullish momentum.
Bullish Marubozu Candle on Weekly Timeframe : The recent formation of a bullish marubozu candle on the weekly chart indicates strong buying pressure and suggests potential for further upward movement.
Increase in Volumes : A noticeable increase in trading volumes confirms the strength of the price move and indicates growing investor interest.
Support at 50 EMA on Weekly Timeframe : The stock took support at the 50-week exponential moving average (EMA) and is now bouncing back, reinforcing the overall bullish sentiment and providing a strong support level.
Higher Highs : The stock is consistently making higher highs, indicating a strong upward trend.
Target - 155 // 170 // 185
Stoploss - weekly close below 97
DISCLAIMER -
Decisions to buy, sell, hold or trade in securities, commodities and other investments involve risk and are best made based on the advice of qualified financial professionals. Any trading in securities or other investments involves a risk of substantial losses. The practice of "Day Trading" involves particularly high risks and can cause you to lose substantial sums of money. Before undertaking any trading program, you should consult a qualified financial professional. Please consider carefully whether such trading is suitable for you in light of your financial condition and ability to bear financial risks. Under no circumstances shall we be liable for any loss or damage you or anyone else incurs as a result of any trading or investment activity that you or anyone else engages in based on any information or material you receive through TradingView or our services.
@visionary.growth.insights

KELLTON TECH BOFA SECURITY BROUGHT TODAY 1.5% SHARES
Rising volume and bullish momentum could reach the Target mentioned surely
Not a buy/Sell Recommendation just Pure Technical Analysis

KELTON Long PostitionalBuy KELTON above 106
Target of 117-128-140-146
SL 74
Strategy : SBO + RSI > 60 + EMA above 20 & 50
Duration few weeks
Please consult your financial advisor before investing
All research for educational purposes only.
Stock is ready to cross past barriers with good volumes

KELLTONTEC - Bullish Setup oNStock name - Kellton Tech Solution Limited.
✅#KELLTONTEC trading above Resistance of 136.
✅Next Resistance is at 190.
✅Moved 50% in 29 weeks.
Weekly chart setup
Chart is self explanatory. Levels of breakout, possible up-moves (where stock may find resistances) and support (close below which, setup will be invalidated) are clearly defined.
Master Score - B
Disclaimer: This is for demonstration and educational purpose only. this is not buying and selling recommendations. I am not SEBI registered. please consult your financial advisor before taking any trade.

Kelton Tech Solution LongMultiyear Weekly Breakout Done
Big Breakout Candle
Very High Volume
Inverse Head & Shoulder Breakout

KELLTONTEC | POSITIONAL | LONG | WEEKLY TFStock is basing very nicely near ATH and looks ready to move out of Stage 1
Price is showing really good momentum
Needs contraction on Daily TF to execute an Entry

Kellton Tech Solutions LtdTarget in charts and SL @75
FUNDAMENTALS
Market Cap
₹ 851 Cr.
Current Price
₹ 88.2
Stock P/E
15.8
Book Value
₹ 38.6
Dividend Yield
0.00 %
ROCE
14.5 %
ROE
10.4 %
Face Value
₹ 5.00
Promoter holding
52.1 %
EPS last year
₹ -13.1
EPS latest quarter
₹ 1.60
Debt
₹ 148 Cr.
Pledged percentage
12.7 %
Net CF
₹ 5.01 Cr.
Price to Cash Flow
35.0
Free Cash Flow
₹ 4.82 Cr.
Debt to equity
0.40
OPM last year
10.2 %
OPM 5Year
13.0 %
Reserves
₹ 325 Cr.
Price to book value
2.28
Int Coverage
6.55
PEG Ratio
-1.92
Price to Sales
0.90
Sales growth 3Years
5.98 %
Profit Var 3Yrs
-14.2 %

Kellton Tech- Nice BreakoutKellton Tech- Nice Breakout
Investing Price -137-140
Breakout Price -137
Stoploss -119
Targets -262
#kelltontech #StockMarketindia #StockToWatch #StocksInFocus #stockstowatch #StocksToTrade

Kellton Tech: (Swing)Kellton Tech: (Swing)
Kellton is well set to to double in the upcoming days.
Appropriate supply, demand and target zones are highlighted.
Trade offers a RR of more than 1:6.
Check out my earlier views for a better understanding.
Note: Do your own due diligence before taking any action.

Kellton Tech Kellton Tech IT company, shown good move.
It was facing resistance at 110, that was cleared last week. now has made a kind of double top at rs 118, above 118 we may see a spike of 128 which was its ath / 52 wk high.
Above that we may see a fresh leg of rally in this counter.
Company works in AI an cloud sector.

Kellton Tech Solutions LtdKellton Tech Solutions Ltd offers services in digital transformation, ERP and other IT services. It has operations across US, Europe, India and Asia-Pacific with a team of ~1,500 employees
Services Offered
The company offers a wide range of services through different platforms to help its clients for their digital transformation. Its services include agile software development, digital commerce & marketing, digital integration, outsourced product development, platform modernization, professional services, technology consulting, testing & automation and others.

Kellton techenter positionally with minimum 100 and then add dips of 20 pts.... Open sky above 150. Enter only positional and no short term view.

Kellton Tech Solutions LtdInformation technology solutions are offered by Kellton Tech Solutions Ltd. Digital Transformation, Enterprise Solutions, and Consulting are the three divisions through which the company conducts business.
Hello, friends
AI (Artificial Intelligence) is a reality today. I looked at a few AI-related businesses, and I found that this one is significantly less expensive than the rest. The data from the previous five years is also strong, and if you frame your outlook as a period of three to five years, I think it will become a portfolio maker.
Personally, I believe that some stocks in a portfolio should be held for a long-term, specific purpose. In my opinion, it has the potential to provide 2X or 3X returns in the near future.
This is not advice; it is just information.
I am not a registered advisor with the SEBI and not a financial advisor.
Please communicate with your financial professional before making an investment.

KelltontecStock name = Kellton Tech Solutions Limited.
Daily chart setup
Chart is self explanatory. Levels of breakout, possible up-moves (where stock may find resistances) and support (close below which, setup will be invalidated) are clearly defined.
Disclaimer: This is for demonstration and educational purpose only. this is not buying and selling recommendations. I am not SEBI registered. please consult your financial advisor before taking any trade.

Kellton techKellton tech formed cup with handle pattern targets market it gave breakout and retested let's see what happens

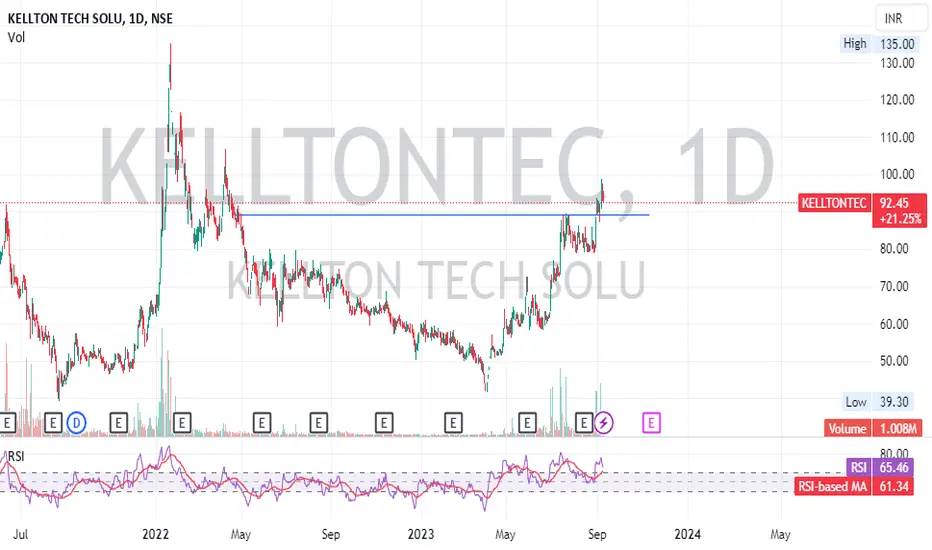
KELLTONTECH BreakoutRSI Rising from bottom
Recent volumes are good.
Breakout again.
Target 1-89
Target 2-94

Kellton TechAlmost nearing 2 year breakout and fundamentally good low PE Stock as well.
Looking good on all the timeframes.
SL below weekly 200 SMA

kellton tech C&H patternKellton Tech Solutions Ltd offers services in digital transformation, ERP and other IT services. It has operations across US, Europe, India and Asia-Pacific with a team of ~1,500 employees