KIRLOSENG trade ideas
KIRLOSENG | Buy @615 | Strict SL below 545Disclaimer:
This is not financial advice. Please do your own research or consult with a financial advisor before making any investment decisions. Investments in stocks can be risky and may result in loss of capital.

Taking support from 61.8% Fib level + pattern breakout Keep a bullish view on this stock as it has give a breakout of the range with strong cadle, make a entry if tomorrow price breks today's high, can keep a stoploss at tha low of the current candle target will be 61.8% retracement level of previous trend that is 1251

KIRLOSKAR OIL ENG LTD S/RSupport and Resistance Levels:
Support Levels: These are price points (green line/shade) where a downward trend may be halted due to a concentration of buying interest. Imagine them as a safety net where buyers step in, preventing further decline.
Resistance Levels: Conversely, resistance levels (red line/shade) are where upward trends might stall due to increased selling interest. They act like a ceiling where sellers come in to push prices down.
Breakouts:
Bullish Breakout: When the price moves above resistance, it often indicates strong buying interest and the potential for a continued uptrend. Traders may view this as a signal to buy or hold.
Bearish Breakout: When the price falls below support, it can signal strong selling interest and the potential for a continued downtrend. Traders might see this as a cue to sell or avoid buying.
20 EMA (Exponential Moving Average):
Above 20 EMA(50 EMA): If the stock price is above the 20 EMA, it suggests a potential uptrend or bullish momentum.
Below 20 EMA: If the stock price is below the 20 EMA, it indicates a potential downtrend or bearish momentum.
Trendline: A trendline is a straight line drawn on a chart to represent the general direction of a data point set.
Uptrend Line: Drawn by connecting the lows in an upward trend. Indicates that the price is moving higher over time. Acts as a support level, where prices tend to bounce upward.
Downtrend Line: Drawn by connecting the highs in a downward trend. Indicates that the price is moving lower over time. It acts as a resistance level, where prices tend to drop.
RSI: RSI readings greater than the 70 level are overbought territory, and RSI readings lower than the 30 level are considered oversold territory.
Combining RSI with Support and Resistance:
Support Level: This is a price level where a stock tends to find buying interest, preventing it from falling further. If RSI is showing an oversold condition (below 30) and the price is near or at a strong support level, it could be a good buy signal.
Resistance Level: This is a price level where a stock tends to find selling interest, preventing it from rising further. If RSI is showing an overbought condition (above 70) and the price is near or at a strong resistance level, it could be a signal to sell or short the asset.
Disclaimer:
I am not a SEBI registered. The information provided here is for learning purposes only and should not be interpreted as financial advice. Consider the broader market context and consult with a qualified financial advisor before making investment decisions.

KIRLOSENGNSE:KIRLOSENG
One Can Enter Now !
Or Wait for Retest of the Trendline (BO) !
Or wait For better R:R ratio !
Note :
1.One Can Go long with a Strict SL below the Trendline or Swing Low.
2. R:R ratio should be 1 :2 minimum
3. Plan as per your RISK appetite and Money Management.
Disclaimer : You are responsible for your Profits and loss, Shared for Educational purpose

Necklace Breakout - Kirloskar Engine OilNecklace Breakout- Kirloskar Eng Oil
A Necklace Breakout - i.e. neckline breakout can explode into wilder momentum like this.
I have been holding this from 300 level. It has grown to 900++ & became 3X now within a year.

KIRLOSKAR OIL AND ENG
There is a wonderful chart of Kirloskar that shows big chances of upward movement. Individuals with mid to long term horizons may want to keep an eye on this chart.


KIRLOSKAR OIL weekly chart C&H patternKOEL, one of the flagship companies of the Kirloskar group, manufactures and services diesel engines and diesel generator sets. The company also makes diesel, petrol and kerosene-based pump sets. It has manufacturing units in Pune, Kagal, and Nashik. The company caters to the agriculture, power generation, and industrial sectors. [1

Long Kirloseng🛡KIRLOSENG
💠Stock Trading above 50 & 200 EMA
💠Stock making Big Base with higher volume
💠 Stock structure is Uptrend
💠 Breakout Level 400 Support 365-70
💠 RR Favorable for going long
♻️ Retweet for max reach

Kirloskar OilsGood buying by MFs @ 322
Kirloskar OIL CMP 390
Buy in dips only till 320/350
SL 310
Target 427/450 ++

Reversal stock: kirloskar oilKirloskar oil is a potential reversal candidate. Keep it on your radar!!Need to close above 337

Kirloskar oil: soon to breakoutKirloskar oil is a soon-to-breakout candidate. Keep it on your radar!!!

KIRLOSKAR ENGINE OIL, crossed the single weekly candle higher crossed the single weekly candle-
buy if it maintains above 298-300 t1-363,t2-396
ATH is 396(2019)

Kirloskar Oil Engines - New BusinessKirloskar Oil Engines Ltd
India’s largest Industrial Engine manufacturer with over 40,000 engines manufactured annually.
India’s largest diesel Agri engines and pump sets manufacturer with over 1,45,000 units manufactured annually.
Products and Brands
Co. develops and offers indigenous engines for agriculture, Genset, and industrial off-highway equipment segments. Their range of products includes 2.5HP to 740HP engines to diesel gensets with a power output of 5kVA to 1,500kVA.
New Business and Products
1.In FY22, co. launched a High-Efficiency 3-Phase L.V. Electric Motor. In addition, co. introduced BS-IV engines in the industrial domain and the Organic Waste Composter (Kirloskar i-Land), the Company also released new products in the Power generation market, comprising the K4300 and R550 series.
2.The Co. had commenced financial service business through its subsidiary company viz. Arka Fincap Limited (previously known as Kirloskar Capital Limited) with effect from 24th April 2019. In FY22, co. invested 50 cr in the rights issue of AFL. Further, on 13th July 2021, it incorporated a WOS- Arka Financial Holdings, for enhancing strategic flexibility in the FS business. Co. invested 837 Cr towards the rights issue of this co. Co. also transferred all of its shares in Arka fin cap to AHFPL
3.The Co. engaged in a Business Association Agreement to create lightweight and compact DG sets for defense projects. In addition, the Co. won a large order for propulsion kits for inland water ferry boats and a refurbishment project
4.In FY22, step-down subsidiary co. Optiqua Pipes and Electricals acquired the business of pipes, cables & wires of Optiflex Industries, on a slump sale basis.
Revenue Mix FY22
Segment Wise:
Engines - 73%
Electric Pumps - 17%
Financial Services - 5%
Other Segments - ~5%
Other Segments include revenue from sales/business operations of farm equipment and spares.
Business Wise
Power Generating Business - 33%
Agriculture & Allied Business - 26%
Industrial Engine Business- 13%
Customer Support - 11%
International Business - ~8%
Large Engine Business - ~4%
Financial Services Business - 5%
Geographical Wise:
Domestic - 88%
Export - ~12%
General Notes
1. Healthy dividend paying stock
2. Last 2 QOQ growth is back to pre covid EPS returns with good sales
3. Though in business for pretty long time but ROI and ROE are meager 9% to 12%
4. Borrowings have increased 1X on YOY - Redflag
5. Cash is net negative - Redflag
6. However debtor days and Inventory cycle days have improved significantly YOY
7. Fii stake have been on decreasing trend. However it is going with DII instead of public shareholding which is littl bit better news for me
8. I WILL PREFER TO WAIT TO BUY THIS ONCE THIS CROSSES 270 RATHER THAN BUY THIS HERE AT CMP

KIRLOSENG - TRENDLINE BREAKOUT 📊 Script: KIRLOSENG (KIRLOSKAR OIL ENGINES LIMITED)
📊 Nifty50 Stock: NO
📊 Sectoral Index: NIFTY AUTO
📊 Sector: Industrials, Capital Goods
📊 Industry: Industrial Products, Diesel Engines
Key highlights: 💡⚡
📈 Script is trading at upper band of BB.
📈 MACD is giving crossover.
📈 Already Crossover in Double Moving Averages.
📈 Right now RSI is around 71.
⏱️ C.M.P 📑💰- 177.30
🟢 Target 🎯🏆 - 200
⚠️ Stoploss ☠️🚫 - 166
⚠️ Important: Always maintain your Risk & Reward Ratio.
✅Like and follow to never miss a new idea!✅
Disclaimer: I am not SEBI Registered Advisor. My posts are purely for training and educational purposes.
Happy learning with trading. Cheers!🥂
🇮🇳 Happy Independence Day 🇮🇳

Random Stock Analysis - Kirloskar Oil######### Kirloskar oil #########
Month:
1. pullback for last 4 months - 50% completed after rally
Weekly:
1. pullback for last 4 months - 50% completed after the rally
2. 29% fall from ATH since July and is matching with 50% in Fib retracement level
Daily:
1. Current Price is below 200 MA - a bearish signal; Need to wait for Breakout
2. Main Correction wave started in July.
3. Sub correction wave ABC started on 05th Oct and completed on 22nd Nov and is confirmed using Fibonacci Retracement level of 1.618 (Rs.181.15) from A point.
4. Now, the current price is Rs.191, which is closer, and waiting for 2 consecutive green candles to appear
5. Once two consecutive green candle appears (around Rs.195), then we can enter immediately with a target of Rs.10-20% (to match B point of ABC wave)
6. if breaches 10% rally, it may go to ATH price of Rs.269, which is 40% from entry point.
Note:
I'm not recommending buying this stock. This is for education purposes.
This is my view, based on my learning.
Please do not trade without your own conviction.
Please invest after careful research. I'm not responsible for your profits/losses.
- Gnanasekaran

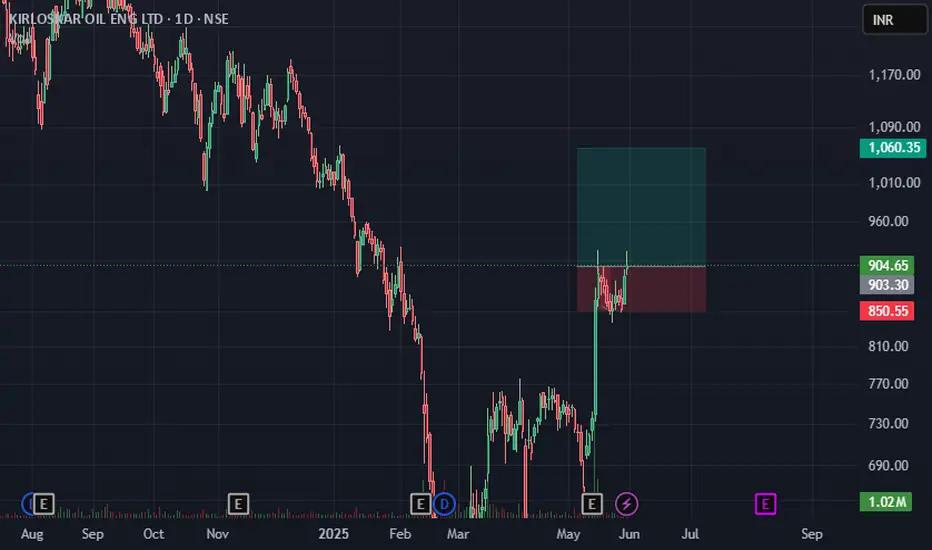
KIRLOSENG, 1:9 risk reward masssive potentialKirloseng has been in a beraish move for quite long time and recently there was good amount of buying seen, if the momentum continues like this we can see it breaking its 52 week high, hold tight and ride the scale,
Guy seeing the risk rewards i myslef have invested 1.1 cr in this. Lets make it together. If you like my idea do give a thumbs up as it take a lot of time to scan good stocks.. thank you so much everyone

Long - KIRLOSKAR OIL ENGINES LTDLong @ 250
SL: 235
AVWAP: 238 - Strong Support Zone
RS: +VE
Trigger:
RSI: Breakout from a downward channel and 1st pullback.
Deliveries: Weekly > Last 3 Weeks - Showing accumulation.
+ ADX @ 28

Kirloshkar oil engi.KIRLOSHKAR OIL HAS GIVEN A VERY GOOD BREAKOUT IN WEEKLY TIMEFRAME.
CMP- 200
TARGET- 310
STOLOSS 180


KIRLOSENG 1D LONGKIRLOSENG is giving breakout after long consolidation.much long consolidation give more powerful movement.

Breakout Buy above 125 for minimum 10%The stock has been consolidating for a while
giving a range breakout at 125 levels
can be bought above 125 if sustained for more than 1hr
1st Target 140s
2nd Target 160s
Stop Loss 110 on Closing Basis
