KOPRAN trade ideas
Kopran can climb further. Kopran Ltd. is a holding company, which engages in the manufacturing of pharmaceuticals and related products. It operates through the following business units: Formulations, and Active Pharmaceutical Ingredients. The firm's products include Amyn, Lokit, and Ciproquin.
Kopran Ltd CMP is 320. The positive aspects of the company are Company with Low Debt, Company with Zero Promoter Pledge, FII / FPI or Institutions increasing their shareholding, Annual Profit Growth higher than Sector Profit Growth AND Mutual Funds Increased Shareholding in Past Month. The Negative aspects of the company are Declining Net Cash Flow : Companies not able to generate net cash AND Stocks in the sell zone based on days traded at current PE and P/BV.
Entry can be taken after closing above 321. Targets in the stock will be 330 and 342. The long-term target in the stock will be 352 AND 368. Stop loss in the stock should be maintained at Closing below 291.
Disclaimer: The above information is provided for educational purpose, analysis and paper trading only. Please don't treat this as a buy or sell recommendation for the stock. We do not guarantee any success in highly volatile market or otherwise. Stock market investment is subject to market risks which include global and regional risks. We will not be responsible for any Profit or loss that may occur due to any financial decision taken based on any data provided in this message.

Kopran Ltd.Multiyear breakout - Cup and Handle - Monthly
Fundamentals:
Company is virtually debt free.
Company has a healthy Interest coverage ratio of 10.89.
The company has an efficient Cash Conversion Cycle of 43.79 days.
Company has a healthy liquidity position with current ratio of 2.22.
The company has a strong degree of Operating leverage, Average Operating leverage stands at 3.33.
The company has shown a poor revenue growth of 14.84% for the Past 3 years.
Company has a poor ROE of 6.79% over the past 3 years.


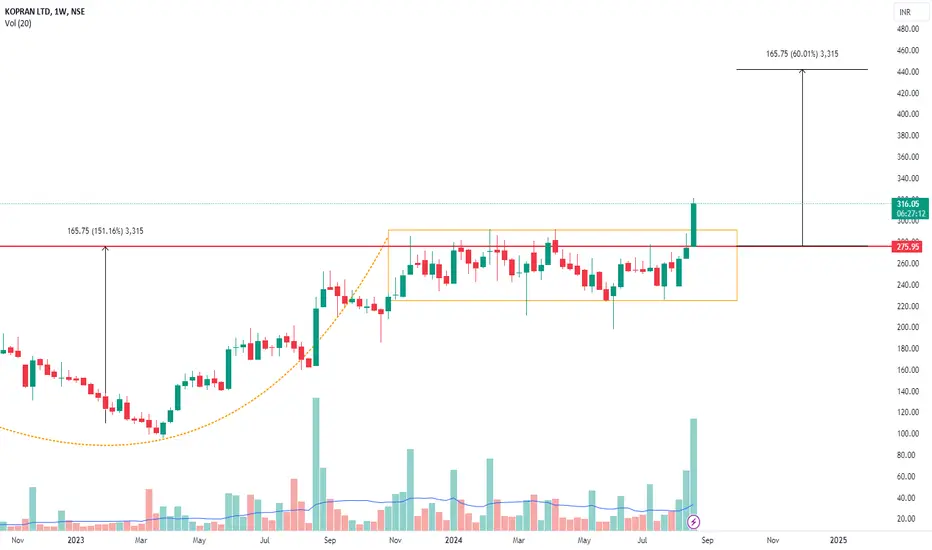
kopran formed cup and handle patternkopran formed cup and handle pattern almost 10 months resistance breakout with good volumes with the support 270-275 we can see 390 & 440
KOPRAN1. Anything can happen.
2. You don't need to know what is going to happen next in order to make money.
3. There is a random distribution between wins and losses for any given set of variables that define an edge. No other thoughts
4. An edge is nothing more than an indication of a higher probability of one thing happening over another.
5. Every moment in the market is unique.

KOPRAN Showed Breakout with Huge Volume at 52 Weeks High ZoneNSE:KOPRAN
The co. has set up a new API plant at Panoli, commercial production at this facility is expected to be started from Q3 FY25. In FY23, it completed upgradation and expansion of the multi-product plant at the Mahad facility for existing products and to manufacture new molecules.
An integrated Pharmaceutical Company, committed to supplying International
Quality Formulations and Active Pharmaceutical Ingredients (APIs) globally.
State-of-the-art manufacturing facilities and products with various accreditations
and approvals by major global regulatory authorities.
The formulations vertical is operated through Kopran Limited.
The API vertical is being operated under Kopran Research Laboratories Ltd.
(KRLL), a wholly owned subsidiary of Kopran Limited

KOPRANKOPRAN LTD has breakout 9 months consolidation with huge volume TGT will high
just for educational purpose only

SWING TRADE IDEASWING TRADE IDEA ascending triangle chart pattern breakout done can look for swing trade with ur prefered RR.

KOPRAN cmp 272.Add to your wachlist and study tha chart.Stock near 52week high and trying to go for all timt high.


KOPRAN - SUPPORT TESTEDWe have touched channel support today and it looks good for SWING LONG trade with Stoploss 221 Closing basis and Target 284 325
Pharma Sector is looking HOT so will definitely be good Buy at current price

KOPRAN BREAKOUTHuge Volume Buildup.
Trading 52 Week high.
Good for Short term.
Target 330,370.
Disclaimer : This is not a Buy or Sell recommendation. I am not SEBI Registered. Please consult your financial advisor before making any investments . This is for Educational purpose only.

BULL FLAG IN KOPRAN LTDStock has given a breakout of bull flag pattern with good volumes.
Next immediate resistance is around 210-225
Keep a track on this stock and trade as per your analysis

Kopran ( Swing Idea!)Kopran is making series of higher highs and higher lows for past couple of months.So lets try to ride its another move, picking from the lows.
Its correcting in a channel pattern and forming Inverted head and shoulder pattern at the same time in lower time frame.
There is two key zones from where price could possibly turn bullish which is highlighted with pink box in charts.
Upside targets are 295 and 310 respectively.
Lets see how price would react in marked zone,price in higher time frame seems very bullish but structural shift from bearish to bullish in lower time frame must keep in mind.
Always trade with more confirmations.

💥Kopran Ltd💥-Nice Breakout💥Kopran Ltd💥-Nice Breakout
Capital to be deployed- 20k
Investing Price-267-271
Breakout Price-267
Stoploss-208
Targets-394-472-1205
RT for max reach
#kopran #stockstowatch #StocksToBuy #StocksInFocus #stocks #StockMarket

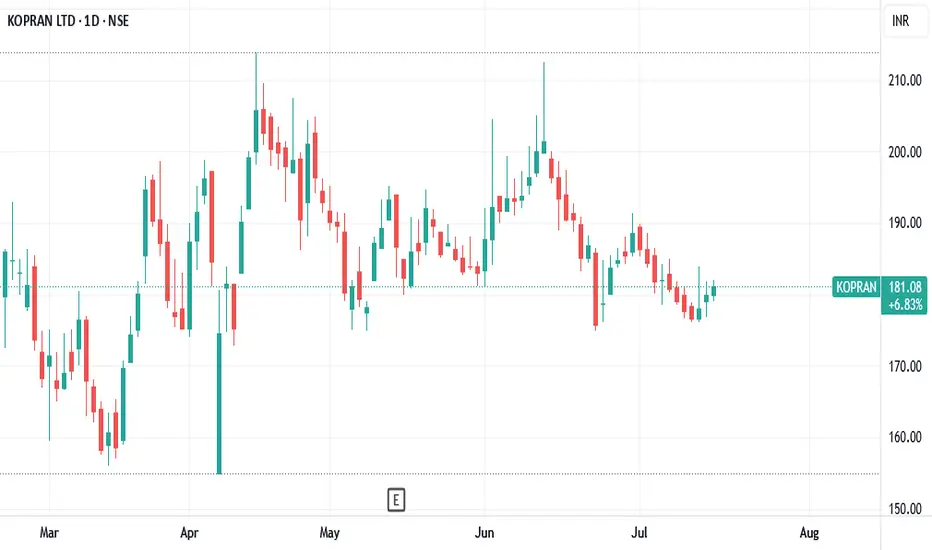
KOPRAN - BULL CHANNELStock is available right at support...Buy at current price 177 and on dips upto 172....Stop 160 on closing basis...Target 215 230 in couple of months


Resistance BreakoutPlease look into the chart for a detailed understanding.
Consider these for short-term & swing trades with 2% profit.
For BTST trades consider booking
target for 1% - 2%
For long-term trades look out for resistance drawn above closing.
Please consider these ideas for educational purpose

Kopran - Bullish Swing OpportunityKopran has given strong breakout on Friday, 2nd June with good volumes. The stock seems to have begun wave 3 on daily chart which could potentially achieve 230+ in about 6-12 weeks from here on. 160-170 remains good demand zone. Setup fails below 140.

KOPRAN - A SWING AS WELL AS POSITIONAL TRADEHELLO FRIENDS,
Here I am sharing my view on KOPRAN LTD (NSE) which is showing bullish bias on the chart.
The stock was in downtrend since December 2021 following the downtrend as Lower Highs and Lower Lows pattern but now the stock has broken this pattern and started doing Higher Highs and Higher Lows which depicts the change or trend to uptrend from downtrend.
It has given breakout of downward sloping Trendline in Weekly time frame.
All the supporting indicators as showing bullish bias on the chart of which snapshots are given below.
Weekly trendline breakout with good intensity of volume
In Daily Time Frame, Stock has given the breakout of FLAG and POLE Chart Pattern in which we calculate first target as same as the size of pole.
Price at the time of breakout is Challenging Upper Bollinger Band
Directional Movement Index is also showing strong Bullish Bias
Price is Trading above 50DEMA, 100DEMA and 200DEMA
MACD in Daily Time Frame - Positive Crossover
MACD in Weekly Time Frame - Positive Uptick
RSI in Daily Time Frame - Positive uptick and above 60 - a bullish sign
Conclusion-
overall stock is bullish on chart, one can enter this stock as swing or positional trade following strict Stop Loss.
Disclaimer-
I am not SEBI registered analyst.
My studies are for educational purpose.
I am not responsible for any kinds of your profits and losses.
please consult your financial advisor before investing your money.

KOPRAN - A Long Term BuyKOPRAN (Log Scale) - The stock has started moving up after correcting almost 80% of the previous wave. This is a long term scenario where the stock will make new highs in the next few months and years.

KOPRAN - DOWNTREND ABOUT TO ENDKopran smallcap Pharma company...I have personally added stock in parts...Seems like downtrend is ready to get over...
Above 160 close...can signal start of uptrend....
Q2 Results will be KEY indicator...
