Kotak Bank | Short | STBTHappy New Year 2025 to all!
As the first trade for 2025, I see Kotak Mahindra providing a good shorting opportunity.
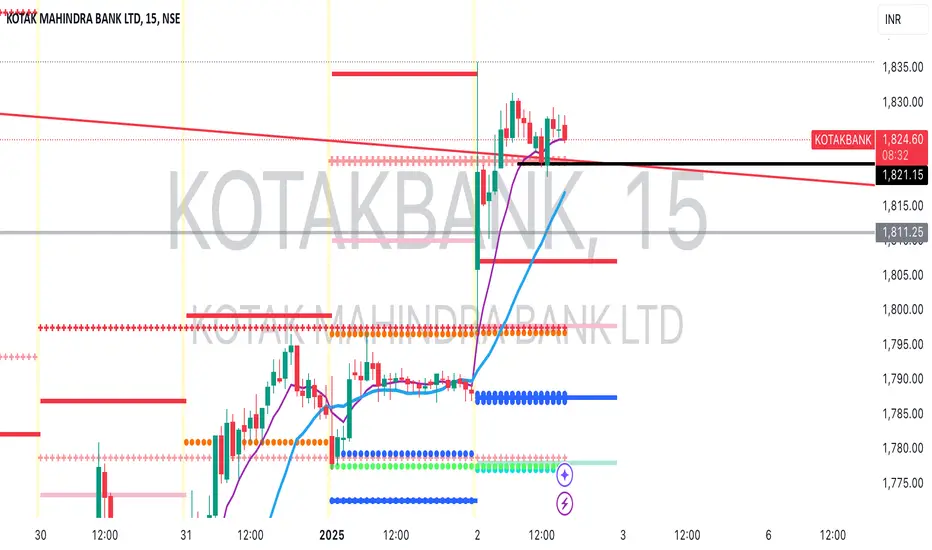
The stock has shot up today and has hit the downward resistance zone trend line.
A short position can be taken once price closes strongly below 1820.
Downside target - 1787
SL - Today's high.
KOTAKBANK trade ideas
Kotak Bank | Short | STBTKotak Bank has formed an excellent triple top and is now breaking down from the Monthly Pivot.
Observe the price action today and you will notice that even the Weekly Pivot has been decisively rejected.
This is giving me the confidence to go short for a target to 1712 level.
SL will be today's high.
This will be an STBT type trade.

KOTAKBANK KEY LEVELS FOR 16/12/2024**Explanation:**
This trading system helps you avoid blind trades by providing confirmation for better entries and exits. It considers volume, past prices, price range and indiavix.
**Entry/Exit Points:**
- **Entry/Exit Lines:** Use the BLACK line for long trades and the RED line for short trades, based on confirmation from your trading plan.
- **Stop Loss:** For long trades, set the stop loss at the RED line below. For short trades, set it at the BLACK line above.
- **Take Profit:** For long trades, target the next RED line above. For short trades, target the next BLACK line below.
**Timeframe:**
Use a 5 timeframe for trading.
**Risk Disclaimer:**
This setup is for educational purposes. I'm not responsible for your gains or losses. Check the chart for more details.

Kotak Mahindra looking positive again. Kotak Mahindra Bank Ltd. Engages in the provision of commercial banking services. It operates through the following segments: Treasury, Balance Sheet Management Unit (BMU) and Corporate Centre; Retail Banking; Corporate or Wholesale Banking; Vehicle Financing, Other Lending Activities; Broking; Advisory and Transactional Services; Asset Management; Insurance and Other Banking Business.
Kotak Mahindra Bank Ltd. CMP 1805.65 is The positive aspects of the company are Attractive Valuation (P.E. = 16.2), Company with Zero Promoter Pledge, RSI indicating price strength, Increasing Revenue every Quarter for the past 8 Quarters and Effectively using its capital to generate profit. The Negative aspects of the company are Stocks Underperforming their Industry Price Change in the Quarter, Increase in Provisions in Recent Results.
Entry can be taken after closing above 1806 Targets in the stock will be 1831, 1855 and 1883. The long-term target in the stock will be 1917 and 1947. Stop loss in the stock should be maintained at Closing below 1749 or 1682 depending on your risk taking ability.
Disclaimer: The above information is provided for educational purpose, analysis and paper trading only. Please don't treat this as a buy or sell recommendation for the stock. We do not guarantee any success in highly volatile market or otherwise. Stock market investment is subject to market risks which include global and regional risks. We will not be responsible for any Profit or loss that may occur due to any financial decision taken based on any data provided in this message.

KOTAK MAHINDRA BANK LTD swing tradeHello,
Trend-Based Analysis. Buy the Dips, Sell The Rallies, Also Following the Trend. Let's see where the Price Action takes us, Riding the wave. Potential trade setups based on trend momentum.
Technical analysis based on trend identification and momentum, Looking for high-probability setups within the prevailing trend.
Analyzing the current market trend and potential future price movement. Focusing on risk management and reward-to-risk ratios.
Details is Mentioned in Chart, Read carefully.. .

Kotak Bank | Long | SwingKotak Bank has been consolidating over the last 10 days or so after hitting a peak.
There is good volatility squeeze that is being demonstrated.
Last weeks' price action shows that price held on to the 2 week low which is a good sign of buyers stepping in.
I'm anticipating an up move once 1793 gets taken out.
Target should be the trend line resistance drawn.

KOTAKBANK : Wave B Reversal in Play – Targeting Higher HighsTechnical Analysis:
Structure: The stock has bounced from a deep retracement zone of Wave B, indicating strong demand and reversal potential.
Key Levels:
Buy Zone: ₹1,705-₹1,750
Stop Loss: ₹1,685 (Below the demand zone)
Target: ₹1,950-₹2,014
Educational Notes:
Wave B Demand Zone: A strong demand area often forms during Wave B, providing attractive buying opportunities.
Profit Zone Identification: Use Fibonacci retracement and projections to estimate reversal targets.
Disclaimer:
This analysis is for educational and illustrative purposes. Ensure risk management is in place and consult a financial advisor if needed.

Kotak Mahindra Bank Ltd view for Intraday 2nd Dec #KOTAKBANK Kotak Mahindra Bank Ltd view for Intraday 2nd Dec #KOTAKBANK
Resistance 1780. Watching above 1783 for upside movement...
Support area 1750 Below 1760 ignoring upside momentum for intraday
Support 1750 Watching below 1746 for downside movement...
Resistance area 1780
Above 1750 ignoring downside move for intraday
Charts for Educational purposes only.
Please follow strict stop loss and risk reward if you follow the level.
Thanks,
V Trade Point

Kotak Upper trendline breakout can give good intraday profits. Kotak Upper trendline breakout can give good intraday profits. All the other things are well explanatory atleast for a week. So Check and trade as I am not a sebi registered analyst so all left to you because its not a recommendation just an analysis. I am just a technical analyst who likes to do analysis of stock charts. So Risk & Rewards left to you. Rgds & thanks.

Kotak Bank looking weak. Short position can be taken in F&OKotak Bank looks super weak as is the case with overall Banking sector.
Short position can be taken for this Month expiry.
Target - 1665 only.

Kotak Mahindra Bank Ltd view for Intraday 11th Nov #KOTAKBANK Kotak Mahindra Bank Ltd view for Intraday 11th Nov #KOTAKBANK
Resistance 1760. Watching above 1765for upside movement...
Support area 1730. Below 1730 ignoring upside momentum for intraday
Support 1730.Watching below 1727for downside movement...
Resistance area 1760
Above 1760 ignoring downside move for intraday
Charts for Educational purposes only.
Please follow strict stop loss and risk reward if you follow the level.
Thanks,
V Trade Point

Kotak Mahindra Bank Ltd for Intraday 7th Nov #KOTAKBANK Kotak Mahindra Bank Ltd for Intraday 7th Nov #KOTAKBANK
Resistance 1780. Watching above 1785 for upside movement...
Support area 1750. Below 1750 ignoring upside momentum for intraday
Support 1750 .Watching below 1745 for downside movement...
Resistance area 1780
Above 1780 ignoring downside move for intraday
Charts for Educational purposes only.
Please follow strict stop loss and risk reward if you follow the level.
Thanks,
V Trade Point

Kotak and Indusind Bank to SBI Ratio at 3.8 target 5Based on Fy25 numbers:
# Kotak @ 1800 is trading at 2.3 time book value assuming 790/share in networth
# Indusind bank @ 1300 is trading at 1.45 times book at assuming 900/share in networth.
# SBI at 815 trading at 1.5 time book value assuming 540 / share networth.
# Kotak + Indusind trading at average PBV of 1.85 times.
# (Kotak+Indusind) / SBI is trading at 3.81 as on 21st Oct 2024.
# The trade is to buy 6,50,000 worth of shares of Kotak and Indusind (50% each) and short 1 futures contract of SBI. The max down side is when both share start trading at 1.5 times combined PBV implying a downside of max 20% (1.85 to 1.5). This seems less likely.
# Ideally the combined PBV of kotak and indusind should trade at 3+2 (2.5) times PBV while SBI should trade at 1.5 times (66.7% more).
# since at 1.85 time combined PBV of Kotak and Indusind is trading at 23.5% premium to SBI, the trade can be closed when the gap reaches 60% premium which implies the Ratio reaches 5.

Kotak Bank Ready to rollKotak Bank Ready to roll, long entry in kotak bank.
Minimum 20% profit for short term, 100% for long term.

KOTAK BANK Targeting a new all time high?📈🚀 KOTAK MAHINDRA BANK READY FOR A BULLISH MOVE? 🚀📈
We're eyeing a promising setup in Kotak Mahindra Bank on the 1-hour chart! After a strong uptrend from the lows of ₹1,770, it looks like we are building momentum for another leg up.
Key Levels to Watch:
📊 Potential Upside:
₹1,920: A crucial resistance, breaking above this could propel us towards ₹1,942, a full retracement level and the previous high on this timeframe.
₹1,942: This level marks the 100% Fibonacci retracement, and surpassing it could signal a strong bullish continuation, with potential targets moving higher as buyers step in.
🛡️ Support & Invalidation:
₹1,903: This level is key as our nearest support. A close below this could invalidate the short-term bullish bias, so keep a close watch. If we hold above, bulls remain in control!
With a rising 50 and 200 EMA showing clear upward momentum, a breakout beyond ₹1,920 can open up a path to test those higher levels. Let's stay alert for strong price action and volume to confirm the move! 💪
🚨 Plan your trade, trade your plan! 🚨

KOTAK BANK - LONGNSE:KOTAKBANK Weekly chart showing accumulation phase completed with positive head and shoulder pattern. Monthly to weekly macd indicates some more upward from current levels.

KOTAK BANK S/R for 11/10/24Support and Resistance Levels:
Support Levels: These are price points (green line/shade) where a downward trend may be halted due to a concentration of buying interest. Imagine them as a safety net where buyers step in, preventing further decline.
Resistance Levels: Conversely, resistance levels (red line/shade) are where upward trends might stall due to increased selling interest. They act like a ceiling where sellers come in to push prices down.
Breakouts:
Bullish Breakout: When the price moves above resistance, it often indicates strong buying interest and the potential for a continued uptrend. Traders may view this as a signal to buy or hold.
Bearish Breakout: When the price falls below support, it can signal strong selling interest and the potential for a continued downtrend. Traders might see this as a cue to sell or avoid buying.
20 EMA (Exponential Moving Average):
Above 20 EMA(50 EMA): If the stock price is above the 20 EMA, it suggests a potential uptrend or bullish momentum.
Below 20 EMA: If the stock price is below the 20 EMA, it indicates a potential downtrend or bearish momentum.
Trendline: A trendline is a straight line drawn on a chart to represent the general direction of a data point set.
Uptrend Line: Drawn by connecting the lows in an upward trend. Indicates that the price is moving higher over time. Acts as a support level, where prices tend to bounce upward.
Downtrend Line: Drawn by connecting the highs in a downward trend. Indicates that the price is moving lower over time. It acts as a resistance level, where prices tend to drop.
RSI: RSI readings greater than the 70 level are overbought territory, and RSI readings lower than the 30 level are considered oversold territory.
Combining RSI with Support and Resistance:
Support Level: This is a price level where a stock tends to find buying interest, preventing it from falling further. If RSI is showing an oversold condition (below 30) and the price is near or at a strong support level, it could be a good buy signal.
Resistance Level: This is a price level where a stock tends to find selling interest, preventing it from rising further. If RSI is showing an overbought condition (above 70) and the price is near or at a strong resistance level, it could be a signal to sell or short the asset.
Disclaimer:
I am not a SEBI registered. The information provided here is for learning purposes only and should not be interpreted as financial advice. Consider the broader market context and consult with a qualified financial advisor before making investment decisions.

Kotak Mahindra BankKotak Mahindra
MTF Analysis
Kotak MahindraYearly Demand 1417
Kotak Mahindra 6 Month Demand BUFL 1740
Kotak MahindraQtrly Demand Breakout 1501
Kotak MahindraMonthly Demand 1601
Kotak MahindraWeekly Demand 1793
Kotak MahindraDaily Demand 1805
ENTRY -1 1793
SL 1758
RISK 35
Potential Target 2091
First Target Points 1907
First recovery Target Points 149
Last Swing Low 1793
Last Swing High 1942
RR 4
RR 17%

kotakbank buy for swing and positional
first buy near 1780
avg at near 1755
sl near 1725 3% sl only play wuth strictly sl
use capital 25-50k
second buy near 1660
avg at near 1610
sl at near 1675 5% sl play safely with strictly sl
use capital 25-50k

Kotak bank is ready to move up and may break previous highKotak bank projected levels are shown in this chart but you should be careful at previous high t1 if it breaks t2 will be achieved then retrace after that it will go for next target.

Kotak Mahindra Bank Ltd view for Intraday 27th September #KOTAKBKotak Mahindra Bank Ltd view for Intraday 27th September #KOTAKBANK
Buying may witness above 1920
Support area 1895-1900. Below ignoring buying momentum for intraday
Selling may witness below 1895
Resistance area 1920
Above ignoring selling momentum for intraday
Charts for Educational purposes only.
Please follow strict stop loss and risk reward if you follow the level.
Thanks,
V Trade Point

Kotak Mahindra Bank Ltd view for Intraday 23rd September #KOTAKBKotak Mahindra Bank Ltd view for Intraday 23rd September #KOTAKBANK
Buying may witness above 1916
Support area 1890. Below ignoring buying momentum for intraday
Selling may witness below 1870
Resistance area 1890
Above ignoring selling momentum for intraday
Charts for Educational purposes only.
Please follow strict stop loss and risk reward if you follow the level.
Thanks,
V Trade Point

Kotak Mahindra Bank Buying Opportunity There is Institution buying zone if price come at that level then we can go long. also Head & Shoulder pattern breakout and Weekly trendline breakout / Retracement.
I am NOT a SEBI registered advisor or a financial adviser. Any of my investment or trade ideas I share on my profile are only my view point.
