KPIT: From Code to Car – Is This the Next Auto-Tech Multibagger?📊 Technical Chart Insights
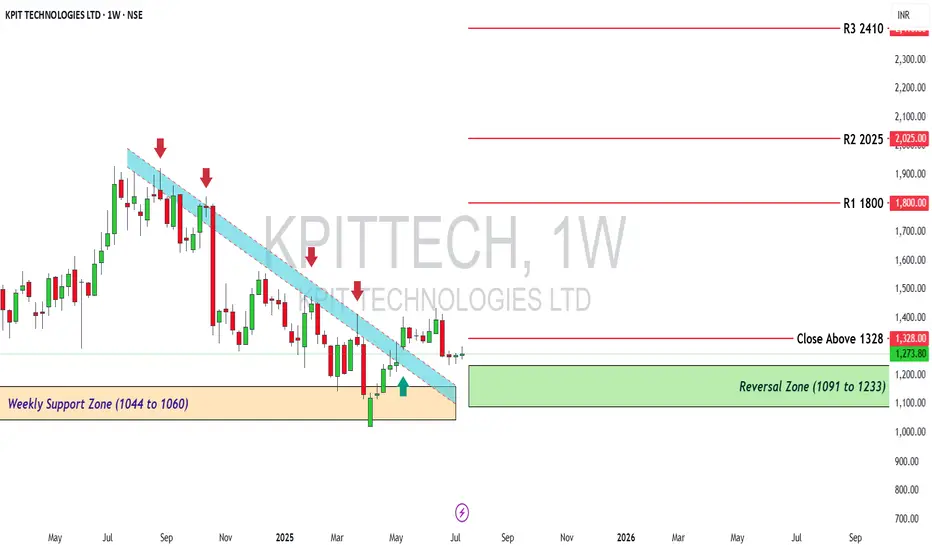
The stock was in a strong downtrend but has now broken above the descending trendline, which is a positive signal.
It has shown a strong reversal from the weekly support zone between ₹1,044 and ₹1,060.
A clear reversal zone is visible between ₹1,091 and ₹1,233 — this is a
Next report date
—
Report period
—
EPS estimate
—
Revenue estimate
—
30.95 INR
8.40 B INR
58.42 B INR
150.25 M
About KPIT TECHNOLOGIES LTD
Sector
Industry
Website
Headquarters
Pune
Founded
2018
ISIN
INE04I401011
FIGI
BBG00K68NWH7
KPIT Technologies Ltd. engages in the provision of software for the automobile and mobility industry. It operates through the following geographical segments: Americas, UK and Europe, and Rest of the World. The company was founded by Shashishekhar Pandit, Kishore Parshuram Patil, and Sachin Dattatraya Tikekar on January 1, 2018 and is headquartered in Pune, India.
Related stocks
Review and plan for 17th June 2025 Nifty future and banknifty future analysis and intraday plan.
Swing trading ideas.
This video is for information/education purpose only. you are 100% responsible for any actions you take by reading/viewing this post.
please consult your financial advisor before taking any action.
----Vinayku

KPITTECH | Buy @LTP | SL below 1300 | Targets 1740, 1900Disclaimer:
This is not financial advice. Please do your own research or consult with a financial advisor before making any investment decisions. Investments in stocks can be risky and may result in loss of capital.

KPIT TECHWeekly Chart
Inside Bar Candle on week 19th May 2025
High 1368
Low 1308
Once cross Either side Breakout will expected

My view on KPITTECH KPITTECH forming inverse Head & Shoulder pattern.
Looking tgt 1330+ very soon👈
Keeping on radar KPITTECH 1300 CE (Small investment hero-zero)
My view only
Giving Pattern for educational purpose only

KPITECH past and short term trendKPITech is a chip designing company for EVs and electronics, They are more active in Europe than the US, so they might have a huge advantage in safeguarding them from Trump Tariffs. The short-term GTT I think would be 1150 for me as there is a big support of around 6 months at this point.

KPIT TECH LONGEntry- 1200 (OR any dip till 1188)
Support- 1150 (which is the hammer candle low)
Target- 1300
Reason- A great reversal can be seen with a hammer candle in 4hr and a bullish engulfing in `1hr with 4hr RSI being oversold.
Disclaimer- This is just for educational purpose please take advice from yo

KPIT Tech- Support held, upmove in progressKPIT TECH- held the support zone perfectly well, next upmove faces resistance at zones mentioned, 0.5 FIB level is the key now.
Take gains if entered short term trades at levels.

KPIT LONGKKPIT
MTF Analysis Price
KPITYearly Demand 801
KPIT 6 Month Demand 1,160
KPITQtrly Demand BUFL 1,219
KPITMonthly Demand 1,251
KPITWeekly Demand 1,110
KPITDaily Demand DMIP 1,137
ENTRY -1 Long 1,219
SL 1,090
RISK 129
REWARD 599
Target as per Entry-1 1,818
RR 5
Last High 1,9

KPITTECH - RSI Divergence on major support/Demand AreaStock currently showing classical RSI Divergence case where price has made a Lower Low and lower high on Major support zone but at the same time RSI is making HH and HL.
This can be a major turning point for stock to start up-moving only in case if it continues to make HH and HL.
RSI divergence is

See all ideas
Summarizing what the indicators are suggesting.
Neutral
SellBuy
Strong sellStrong buy
Strong sellSellNeutralBuyStrong buy
Neutral
SellBuy
Strong sellStrong buy
Strong sellSellNeutralBuyStrong buy
Neutral
SellBuy
Strong sellStrong buy
Strong sellSellNeutralBuyStrong buy
An aggregate view of professional's ratings.
Neutral
SellBuy
Strong sellStrong buy
Strong sellSellNeutralBuyStrong buy
Neutral
SellBuy
Strong sellStrong buy
Strong sellSellNeutralBuyStrong buy
Neutral
SellBuy
Strong sellStrong buy
Strong sellSellNeutralBuyStrong buy
Displays a symbol's price movements over previous years to identify recurring trends.
Frequently Asked Questions
The current price of KPITTECH is 1,218.40 INR — it has increased by 1.56% in the past 24 hours. Watch KPIT TECHNOLOGIES LTD stock price performance more closely on the chart.
Depending on the exchange, the stock ticker may vary. For instance, on NSE exchange KPIT TECHNOLOGIES LTD stocks are traded under the ticker KPITTECH.
KPITTECH stock has fallen by −4.21% compared to the previous week, the month change is a −5.10% fall, over the last year KPIT TECHNOLOGIES LTD has showed a −32.31% decrease.
We've gathered analysts' opinions on KPIT TECHNOLOGIES LTD future price: according to them, KPITTECH price has a max estimate of 1,595.00 INR and a min estimate of 1,000.00 INR. Watch KPITTECH chart and read a more detailed KPIT TECHNOLOGIES LTD stock forecast: see what analysts think of KPIT TECHNOLOGIES LTD and suggest that you do with its stocks.
KPITTECH reached its all-time high on Jul 12, 2024 with the price of 1,928.70 INR, and its all-time low was 34.35 INR and was reached on Mar 26, 2020. View more price dynamics on KPITTECH chart.
See other stocks reaching their highest and lowest prices.
See other stocks reaching their highest and lowest prices.
KPITTECH stock is 3.32% volatile and has beta coefficient of 1.64. Track KPIT TECHNOLOGIES LTD stock price on the chart and check out the list of the most volatile stocks — is KPIT TECHNOLOGIES LTD there?
Today KPIT TECHNOLOGIES LTD has the market capitalization of 327.00 B, it has increased by 2.70% over the last week.
Yes, you can track KPIT TECHNOLOGIES LTD financials in yearly and quarterly reports right on TradingView.
KPIT TECHNOLOGIES LTD is going to release the next earnings report on Jul 30, 2025. Keep track of upcoming events with our Earnings Calendar.
KPITTECH earnings for the last quarter are 8.90 INR per share, whereas the estimation was 7.40 INR resulting in a 20.24% surprise. The estimated earnings for the next quarter are 7.16 INR per share. See more details about KPIT TECHNOLOGIES LTD earnings.
KPIT TECHNOLOGIES LTD revenue for the last quarter amounts to 15.28 B INR, despite the estimated figure of 15.46 B INR. In the next quarter, revenue is expected to reach 15.29 B INR.
KPITTECH net income for the last quarter is 2.45 B INR, while the quarter before that showed 1.87 B INR of net income which accounts for 30.89% change. Track more KPIT TECHNOLOGIES LTD financial stats to get the full picture.
KPIT TECHNOLOGIES LTD dividend yield was 0.65% in 2024, and payout ratio reached 27.48%. The year before the numbers were 0.45% and 30.53% correspondingly. See high-dividend stocks and find more opportunities for your portfolio.
As of Jul 29, 2025, the company has 10.47 K employees. See our rating of the largest employees — is KPIT TECHNOLOGIES LTD on this list?
EBITDA measures a company's operating performance, its growth signifies an improvement in the efficiency of a company. KPIT TECHNOLOGIES LTD EBITDA is 12.30 B INR, and current EBITDA margin is 21.33%. See more stats in KPIT TECHNOLOGIES LTD financial statements.
Like other stocks, KPITTECH shares are traded on stock exchanges, e.g. Nasdaq, Nyse, Euronext, and the easiest way to buy them is through an online stock broker. To do this, you need to open an account and follow a broker's procedures, then start trading. You can trade KPIT TECHNOLOGIES LTD stock right from TradingView charts — choose your broker and connect to your account.
Investing in stocks requires a comprehensive research: you should carefully study all the available data, e.g. company's financials, related news, and its technical analysis. So KPIT TECHNOLOGIES LTD technincal analysis shows the sell today, and its 1 week rating is sell. Since market conditions are prone to changes, it's worth looking a bit further into the future — according to the 1 month rating KPIT TECHNOLOGIES LTD stock shows the sell signal. See more of KPIT TECHNOLOGIES LTD technicals for a more comprehensive analysis.
If you're still not sure, try looking for inspiration in our curated watchlists.
If you're still not sure, try looking for inspiration in our curated watchlists.