KPIT: From Code to Car – Is This the Next Auto-Tech Multibagger?📊 Technical Chart Insights
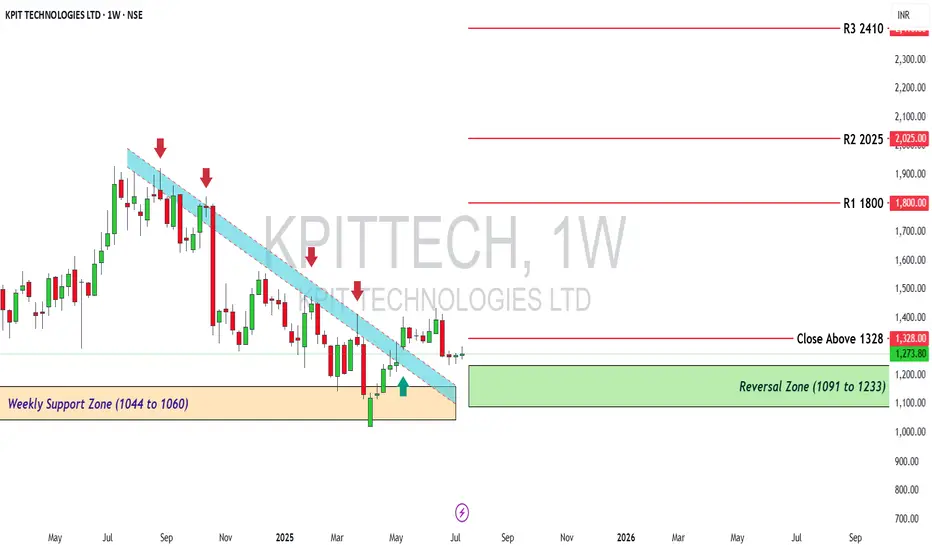
The stock was in a strong downtrend but has now broken above the descending trendline, which is a positive signal.
It has shown a strong reversal from the weekly support zone between ₹1,044 and ₹1,060.
A clear reversal zone is visible between ₹1,091 and ₹1,233 — this is a good accumulation or buy zone for long-term investors.
The stock is currently facing resistance at ₹1,328. A weekly close above this level can confirm a breakout.
If the breakout happens, potential price targets are:
₹1,800 (R1)
₹2,025 (R2)
₹2,410 (R3)
🧠 Investment Strategy Based on Both Views
For Long-Term Investors:
KPIT has strong fundamentals, is in a future-ready business, and is debt-free.
Ideal to buy in dips within ₹1,090 to ₹1,200 range (reversal zone).
Add more if the stock gives a weekly close above ₹1,328.
For Short-Term Traders:
Avoid entries until the stock closes above ₹1,328.
You can enter short-term trades near ₹1,090–₹1,200, with a stop-loss below ₹1,044.
Watch for upside moves towards ₹1,800 or higher if breakout holds.
✅ Strengths
High revenue and profit growth
Strong cash flow and zero debt
High return on equity and capital
Serves leading global auto brands
Positioned well for the EV and autonomous vehicle boom
⚠️ Risks
Valuation is high, so returns may slow in the short term
Relies heavily on global auto industry health
Any correction in global markets can affect KPIT stock
📌 Conclusion
KPIT is a strong company fundamentally and is showing technical signs of reversal.
Ideal for long-term investors looking for growth in auto-tech.
Best approach: buy on dips or breakout above ₹1,328.
Be cautious of short-term volatility but confident in long-term potential.
Disclaimer: lnkd.in
KPITTECH trade ideas
Review and plan for 17th June 2025 Nifty future and banknifty future analysis and intraday plan.
Swing trading ideas.
This video is for information/education purpose only. you are 100% responsible for any actions you take by reading/viewing this post.
please consult your financial advisor before taking any action.
----Vinaykumar hiremath, CMT

KPITTECH | Buy @LTP | SL below 1300 | Targets 1740, 1900Disclaimer:
This is not financial advice. Please do your own research or consult with a financial advisor before making any investment decisions. Investments in stocks can be risky and may result in loss of capital.

KPIT TECHWeekly Chart
Inside Bar Candle on week 19th May 2025
High 1368
Low 1308
Once cross Either side Breakout will expected

My view on KPITTECH KPITTECH forming inverse Head & Shoulder pattern.
Looking tgt 1330+ very soon👈
Keeping on radar KPITTECH 1300 CE (Small investment hero-zero)
My view only
Giving Pattern for educational purpose only

KPITECH past and short term trendKPITech is a chip designing company for EVs and electronics, They are more active in Europe than the US, so they might have a huge advantage in safeguarding them from Trump Tariffs. The short-term GTT I think would be 1150 for me as there is a big support of around 6 months at this point.

KPIT TECH LONGEntry- 1200 (OR any dip till 1188)
Support- 1150 (which is the hammer candle low)
Target- 1300
Reason- A great reversal can be seen with a hammer candle in 4hr and a bullish engulfing in `1hr with 4hr RSI being oversold.
Disclaimer- This is just for educational purpose please take advice from your own financial advisor before taking any decision.
Jai Shree Ram.

KPIT Tech- Support held, upmove in progressKPIT TECH- held the support zone perfectly well, next upmove faces resistance at zones mentioned, 0.5 FIB level is the key now.
Take gains if entered short term trades at levels.

KPIT LONGKKPIT
MTF Analysis Price
KPITYearly Demand 801
KPIT 6 Month Demand 1,160
KPITQtrly Demand BUFL 1,219
KPITMonthly Demand 1,251
KPITWeekly Demand 1,110
KPITDaily Demand DMIP 1,137
ENTRY -1 Long 1,219
SL 1,090
RISK 129
REWARD 599
Target as per Entry-1 1,818
RR 5
Last High 1,921
Last Low 1,090
ENTRY -2 Long 1,110
SL 1,090
RISK 20
REWARD 708
Target as per Entry-2 1,818
RR 35
Last High 1,921
Last Low 1,090
Trade Set Up
Buy Volume -1 As per Entry-1 1,000
Buy Volume -2 As per Entry-2 1,000
Average Buy Price 1,165
Trade Value 2,329,000
SL Point 1,090
RISK 75
Exit Target 1,818
Target Value 3,636,000
Profit Target 1,307,000
RISK Value 149,000
Risk to Reward 9

KPITTECH - RSI Divergence on major support/Demand AreaStock currently showing classical RSI Divergence case where price has made a Lower Low and lower high on Major support zone but at the same time RSI is making HH and HL.
This can be a major turning point for stock to start up-moving only in case if it continues to make HH and HL.
RSI divergence is just a price behavior indicator which give indication of demand at demand zone and a confirmation of is always needed to support this fact by stock behavior making HH and HL.

KPIT TECHKPIT Technologies Ltd seems has finished its 4th wave with invalidation 1283.25.
No Buy sell recommendation just a view.

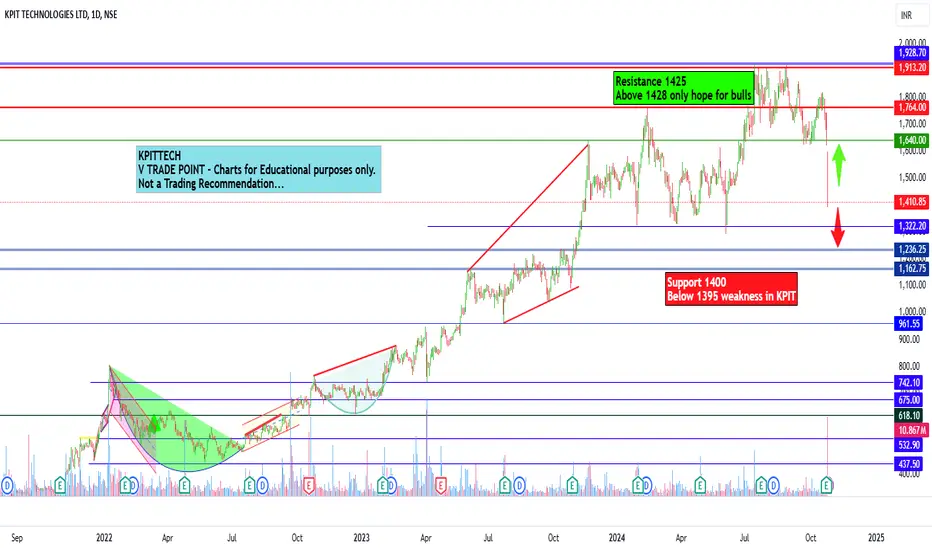
KPIT Technologies Ltd for Intraday 25th October #KPITTECH KPIT Technologies Ltd for Intraday 25th October #KPITTECH
Resistance 1425. Watching above 1428 for upside movement...
Support area 1400. Below 1400 ignoring upside momentum for intraday
Support 1400.Watching below 1395 for downside movement...
Resistance area 1420-1425
Above 1400 ignoring downside move for intraday
Charts for Educational purposes only.
Please follow strict stop loss and risk reward if you follow the level.
Thanks,
V Trade Point
KPIT TECH S/RSupport and Resistance Levels:
Support Levels: These are price points (green line/shade) where a downward trend may be halted due to a concentration of buying interest. Imagine them as a safety net where buyers step in, preventing further decline.
Resistance Levels: Conversely, resistance levels (red line/shade) are where upward trends might stall due to increased selling interest. They act like a ceiling where sellers come in to push prices down.
Breakouts:
Bullish Breakout: When the price moves above resistance, it often indicates strong buying interest and the potential for a continued uptrend. Traders may view this as a signal to buy or hold.
Bearish Breakout: When the price falls below support, it can signal strong selling interest and the potential for a continued downtrend. Traders might see this as a cue to sell or avoid buying.
20 EMA (Exponential Moving Average):
Above 20 EMA(50 EMA): If the stock price is above the 20 EMA, it suggests a potential uptrend or bullish momentum.
Below 20 EMA: If the stock price is below the 20 EMA, it indicates a potential downtrend or bearish momentum.
Trendline: A trendline is a straight line drawn on a chart to represent the general direction of a data point set.
Uptrend Line: Drawn by connecting the lows in an upward trend. Indicates that the price is moving higher over time. Acts as a support level, where prices tend to bounce upward.
Downtrend Line: Drawn by connecting the highs in a downward trend. Indicates that the price is moving lower over time. It acts as a resistance level, where prices tend to drop.
RSI: RSI readings greater than the 70 level are overbought territory, and RSI readings lower than the 30 level are considered oversold territory.
Combining RSI with Support and Resistance:
Support Level: This is a price level where a stock tends to find buying interest, preventing it from falling further. If RSI is showing an oversold condition (below 30) and the price is near or at a strong support level, it could be a good buy signal.
Resistance Level: This is a price level where a stock tends to find selling interest, preventing it from rising further. If RSI is showing an overbought condition (above 70) and the price is near or at a strong resistance level, it could be a signal to sell or short the asset.
Disclaimer:
I am not a SEBI registered. The information provided here is for learning purposes only and should not be interpreted as financial advice. Consider the broader market context and consult with a qualified financial advisor before making investment decisions.

KPIT LONGKPIT
MTF Analysis
KPIT Yearly Demand Breakout 1640
KPIT 6 Month Demand Breakout 1640
KPIT Qtrly Demand Breakout 1640
KPIT Monthly Demand Breakout avg 1532
KPIT Weekly BUFL 1597
KPIT 240 m dmip 1662
ENTRY 1662
SL 1640
RISK 22
Target 2120
REWARD POINT 458
Last High 1891
RR 20.82
RR 28%

KPIT TECHNOLOGIES LTD TIME TO BREKOUT 13% TO 30% PROFITKPIT TECHNOLOGIES ready for fresh move. Trangle breakout on this stock.
SL = 1620
Target = 2120 to 2350
looking good on this price point. supported by awesome volume.
Don't lose more than your entry reason.

KPIT Technologies Ltd view for Intraday 29th August #KPITTECH KPIT Technologies Ltd view for Intraday 29th August #KPITTECH
Buying may witness above 1885
Support area 1850.. Below ignoring buying momentum for intraday
Selling may witness below 1820
Resistance area 1850
Above ignoring selling momentum for intraday
Charts for Educational purposes only.
Please follow strict stop loss and risk reward if you follow the level.
Thanks,
V Trade Point

KPITech taking off...Ready for another rally, can touch 2200-2500 this time. Breaking out after consolidation of 5 months. Not good if it falls below 1650.

KPIT TECHKindly do your own study. This study is only for view discussion.
Kpit tech is in momentum in higher time frame and making higher high and higher low.
Monthly price has challenged upper bollinger band
Monthly MACD is in PCO stat
Weekly price has given ATH BO with high volume
Weekly MACD has given PCO above zero line.
Weekly RSI is above 60 level
Weekly ADX is showing strength
Daily price has given breakout with huge volume
Daily RSI is above 60
Daily ADX is strong


All indicators showing and the Share also on resistance label anThis share in his second inning and about to break his resistance all volume and my indicator indicate me break outside can happen anytime so keep Eye on resistance it can happen anytime

Double support setup Price ne strong resistance ko break kiya aur support ko retest kiya. Dusri confirmation 20 EMA support se mili

NSE:KPITTECH Trendline and Resistance BreakoutTechnical Analysis:
KPITTECH has recently demonstrated a bullish breakout above a significant trendline and resistance level, indicating potential for further upward momentum in the stock price. This breakout is reinforced by technical indicators and price action, suggesting additional gains are probable.
Trendline Breakout:
The stock had been consolidating below a long-term descending trendline for several weeks. Recently, KPITTECH broke above this trendline, indicating a potential trend reversal from bearish to bullish. The breakout occurred around the ₹1600 level, which had been a significant resistance point.
Resistance Breakout:
In addition to breaking the trendline, KPITTECH also surpassed a critical horizontal resistance level at ₹1620. This level had previously acted as a strong barrier, but the recent price action suggests that the bulls have taken control.
Volume Confirmation:
The breakout was accompanied by a notable increase in trading volume, providing additional confirmation of the bullish trend. This surge in volume indicates strong buying interest and enhances the reliability of the breakout.
Potential Trade Setup:
Entry Point: After a confirmed breakout above the ₹1640 level.
Stop Loss: Below the recent swing low at ₹1610.
Target 1: ₹1997
Target 2: ₹2030
RSI Analysis:
The Relative Strength Index (RSI) is currently trending upwards, indicating increased buying pressure. The RSI remains below the overbought territory, suggesting there is still room for further price appreciation.
Moving Averages:
The stock is trading above its 50-day and 200-day moving averages, further confirming the bullish sentiment. The crossover of the 50-day moving average above the 200-day moving average (Golden Cross) adds to the bullish outlook.
MACD Analysis:
The Moving Average Convergence Divergence (MACD) indicator shows a bullish crossover, with the MACD line crossing above the signal line. This crossover supports the bullish trend and the potential for higher prices.
Disclaimer:
This analysis is for informational purposes only and does not constitute investment advice. Trading stocks and other financial instruments involves risk and can result in significant financial loss. Past performance is not indicative of future results. Always conduct your own research or consult with a professional financial advisor before making any investment decisions.
