Kpr millsKPR Mill 🧵 | Solid Base with upmove Potential!!
Volume and structure suggest accumulation — keeping it on radar for a potential breakout.
KPRMILL trade ideas

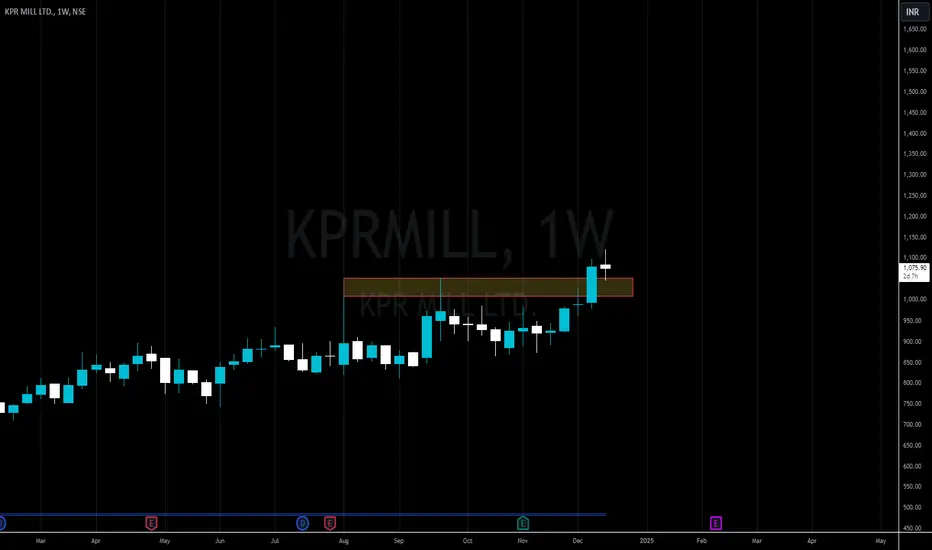
KPR Mill LtdThe stock is trading within a well-defined Darvas Box, with support holding strong around ₹1050 and resistance capped at ₹1160. After forming a solid bottom, today’s price action is showing a strong move with volume, indicating renewed interest.
This consolidation phase has matured, and a breakout above ₹1160 could trigger a significant bullish move. The structure suggests accumulation, and the reaction at ₹1050 further confirms buyer defense.
If the price clears the box, momentum could follow quickly.
Watching closely – breakout could unlock real potential. Not financial advice.

KPRMIll 1067 Trend directionKPR Mill 1067 has given V shaped pattern, WE expect it will test 1170 in coming days.
Reason for suggesting KPR mills
10 Years ROE at 22%
Compounded Sales growth 10% & profit growth 19 % in last 10 years
FII's have consistently increasing stake hold.

KPR Mill Ltd (NSE) – Weekly ChartTechnical Analysis Notes :
Chart Type & Timeframe
Timeframe: Weekly (1W)
Instrument: KPR Mill Ltd (NSE)
Currency: INR
Pattern Observed
Rising Wedge Pattern identified, typically bearish.
Bullish breakout above the upper trendline, invalidating the bearish setup.
Breakout indicates strong bullish momentum.
Volume Analysis
Significant volume spike during breakout candle.
Confirms institutional participation and breakout reliability.
Price Action
Breakout occurred above resistance zone of ₹1,200–₹1,250.
Strong weekly close at ₹1,306.25, up +26.83%.
Candle indicates high conviction buying.
Support & Resistance
Support (former resistance): ₹1,200–₹1,250
Immediate resistance: Around ₹1,400
Next resistance zone (projected): ₹1,500–₹1,600
Indicators & Signals
No indicators shown, but price action and volume strongly bullish.
Long breakout candle = momentum confirmation.
Conclusion
Bias: Bullish
Trade Idea:
Buy on dips near ₹1,250–₹1,280
Stop Loss: Below ₹1,200
Targets: ₹1,400 (short term), ₹1,500+ (medium term)

KPR Mill (long leg candle)1 year daily chart given bre4ak out
RSI Above 60
Volume Increase
Resistance 1190 crossed now become support
Expected level 1626
formed long leg Bod candle

Amazing breakout on Weekly Timeframe - KPRMILLCheckout an amazing breakout happened in the stock in Weekly timeframe, macroscopically seen in Daily timeframe. Having a great favor that the stock might be bullish expecting a staggering returns of minimum 25% TGT. IMPORTANT BREAKOUT LEVELS ARE ALWAYS RESPECTED!
NOTE for learners: Place the breakout levels as per the chart shared and track it yourself to get amazed!!
#No complicated chart patterns
#No big big indicators
#No Excel sheet or number magics
TRADE IDEA: WAIT FOR THE STOCK TO BREAKOUT IN LOWER TIMEFRAME AND RETRACE IF NEEDED. SL IS NEARER SUPPORT ZONE IN Daily TIMEFRAME.
Checkout an amazing breakout happened in the stock in Weekly timeframe.
Breakouts happening in longer timeframe is way more powerful than the breakouts seen in Daily timeframe. You can blindly invest once the weekly candle closes above the breakout line and stay invested forever. Also these stocks breakouts are lifelong predictions, it means technically these breakouts happen giving more returns in the longer runs. Hence, even when the scrip makes a loss of 10% / 20% / 30% / 50%, the stock will regain and turn around. Once they again enter the same breakout level, they will flyyyyyyyyyyyy like a ROCKET if held in the portfolio in the longer run.
Time makes money, GREEDY & EGO will not make money.
Also, magically these breakouts tend to prove that the companies turn around and fundamentally becoming strong. Also the magic happens when more diversification is done in various sectors under various scripts with equal money invested in each N500 scripts.
The real deal is when to purchase and where to purchase the stock. That is where Breakout study comes into play.
LET'S PUMP IN SOME MONEY AND REVOLUTIONIZE THE NATION'S ECONOMY!
KPRMILL cmp 934Stock trading in its all time high zone. And its 52 week high zone also. It showing that it giving a horizontal line breakout with gaining volume .With the confirmation of Upper Bollinger band Breakout.We can find a swing trade in this stock with 1: 4 Risk Reward ratio. Add to wachlist and see what happen in coming days.

KPR mill: on Nov 2024 , cmp :996 Showing consistant higher low KPR mill: on Nov 2024 , cmp :996
Showing consistant higher low and last weekly candle has shown engulfin confirmation.
Enter at 7% SL for 5 years investment

KPR MILL LTD S/RSupport and Resistance Levels:
Support Levels: These are price points (green line/shade) where a downward trend may be halted due to a concentration of buying interest. Imagine them as a safety net where buyers step in, preventing further decline.
Resistance Levels: Conversely, resistance levels (red line/shade) are where upward trends might stall due to increased selling interest. They act like a ceiling where sellers come in to push prices down.
Breakouts:
Bullish Breakout: When the price moves above resistance, it often indicates strong buying interest and the potential for a continued uptrend. Traders may view this as a signal to buy or hold.
Bearish Breakout: When the price falls below support, it can signal strong selling interest and the potential for a continued downtrend. Traders might see this as a cue to sell or avoid buying.
20 EMA (Exponential Moving Average):
Above 20 EMA(50 EMA): If the stock price is above the 20 EMA, it suggests a potential uptrend or bullish momentum.
Below 20 EMA: If the stock price is below the 20 EMA, it indicates a potential downtrend or bearish momentum.
Trendline: A trendline is a straight line drawn on a chart to represent the general direction of a data point set.
Uptrend Line: Drawn by connecting the lows in an upward trend. Indicates that the price is moving higher over time. Acts as a support level, where prices tend to bounce upward.
Downtrend Line: Drawn by connecting the highs in a downward trend. Indicates that the price is moving lower over time. It acts as a resistance level, where prices tend to drop.
RSI: RSI readings greater than the 70 level are overbought territory, and RSI readings lower than the 30 level are considered oversold territory.
Combining RSI with Support and Resistance:
Support Level: This is a price level where a stock tends to find buying interest, preventing it from falling further. If RSI is showing an oversold condition (below 30) and the price is near or at a strong support level, it could be a good buy signal.
Resistance Level: This is a price level where a stock tends to find selling interest, preventing it from rising further. If RSI is showing an overbought condition (above 70) and the price is near or at a strong resistance level, it could be a signal to sell or short the asset.
Disclaimer:
I am not a SEBI registered. The information provided here is for learning purposes only and should not be interpreted as financial advice. Consider the broader market context and consult with a qualified financial advisor before making investment decisions.

SWING IDEA - KPR MILL LTDToday, we delve into KPR Mill Ltd , where a confluence of technical factors suggests a potential swing buying opportunity.
Reasons are listed below :
KPR Mill Ltd recently revisited the critical support at 760 levels, a zone that has historically proven significant. The noteworthy aspect is the successful breach and subsequent retest, signaling potential strength.
Weekly charts showcase a bullish dragonfly doji, signaling a potential trend reversal, while daily charts reveal a bullish hammer pattern, enhancing positive sentiment.
The stock bounced precisely off the 200-day Exponential Moving Average (EMA) on the daily chart, highlighting this level as a robust support.
Continuous formation of higher highs affirms the sustained uptrend in KPR Mill Ltd, reflecting positive market sentiment.
With the stock trading above both the 50-day and 200-day EMAs, there is added strength to the current positive trend.
Target - 861 // 928 // 1050
StopLoss - weekly close below 716
DISCLAIMER -
Decisions to buy, sell, hold or trade in securities, commodities and other investments involve risk and are best made based on the advice of qualified financial professionals. Any trading in securities or other investments involves a risk of substantial losses. The practice of "Day Trading" involves particularly high risks and can cause you to lose substantial sums of money. Before undertaking any trading program, you should consult a qualified financial professional. Please consider carefully whether such trading is suitable for you in light of your financial condition and ability to bear financial risks. Under no circumstances shall we be liable for any loss or damage you or anyone else incurs as a result of any trading or investment activity that you or anyone else engages in based on any information or material you receive through TradingView or our services.
@visionary.growth.insights

KPR Mill - Falling WedgeKPR Mill ::
Falling Wedge breakout
Resistance at 968 levels, need to sustain for an upmove

KPR mill boom boom boom be ready for a roller coaster ride.KPR mill can double from here with in few days. Sl below the trend line.
Chart is self explanatory. Please follow the price action & take the trade as per your appetite.
The information provided here is only for educational purpose. The information provided here is not intended to be any kind of financial advice, investment advice, and trading advice. Investment in stock market is very risky and trading stocks, options and other securities involve risk. The risk of loss in stock market can be substantial. Moreover, I am not a SEBI registered analyst, so before taking any decision or before investing in any Share consult your financial advisor and also do your analysis and research.
Please support and engage by liking, commenting, and following to show your encouragement.

KPR MILLS - READY???The chart is pretty self-explanatory as always.
if you have any doubts or queries, let me know in the comments below.
⚠️Disclaimer: We are not registered advisors. The views expressed here are merely personal opinions. Irrespective of the language used, Nothing mentioned here should be considered as advice or recommendation. Please consult with your financial advisors before making any investment decisions. Like everybody else, we too can be wrong at times ✌🏻

Kpr GreenIt is looking good in chart pattern.
Consolidated so far best to grab at this price
Note: im not SEBI registered not recommending buy/sell

kpr millcup with handle pattern
at resistance level, stock consolidate
good sign for the stock
check out chart
no recommendation for buy and sell
fundamentally good stocks you can invest in
When it gets low, you can add this.

KPRMILL given breakout from Inverted head and shoulderKPRMILL rebounded from 200 sma and given inverted head and shoulder breakout. Buy on current levels and average it if comes to 800. We can aim for a fresh ATH.
Keep SL at 770

Short KPRMILLThe Market is heavy sell side but it will take a breath and follow the fall
As per price action formation has been made in 1 week TF.
Its a very big move.
Always check the sentiments of the market as per technical analysis, if the pattern get its respect.
Best of luck to all traders.
You are responsible for your Profits and loss, Shared for Educational purpose.

K P R Mill LtdTarget - Given in chart
SL - As per your apetite
Old Chart
FUNDAMENTALS
Market Cap
₹ 28,570 Cr.
Current Price
₹ 836
High / Low
₹ 928 / 543
Stock P/E
35.6
Book Value
₹ 118
Dividend Yield
0.47 %
ROCE
24.4 %
ROE
23.4 %
Face Value
₹ 1.00
Price to book value
7.05
Intrinsic Value
₹ 387
PEG Ratio
1.57
Price to Sales
4.53
Debt
₹ 843 Cr.
Debt to equity
0.21
Int Coverage
14.5
Reserves
₹ 4,009 Cr.
Promoter holding
73.8 %
Pledged percentage
0.00 %
EPS last year
₹ 23.8
Net CF
₹ -12.7 Cr.
Price to Cash Flow
95.7
Free Cash Flow
₹ -52.0 Cr.
OPM last year
20.6 %
Return on assets
15.4 %
Industry PE
30.2
Sales growth
11.0 %

KPR MILL(D)KPR Mill witnessing a falling trendline breakout on the daily timeframe. Traders observing for potential continuation of bullish momentum following this breakout.

TARGET DONE IN KPR MILL As i told you that Target has been done.
Our technical anyalsis has gone proper.

KPR Mill post bo consolidationKPR Mill has cleared its Jan 2022 high and went into consolidation.
It has now formed an inverse Head and Shoulders pattern on the daily chart and trying to break out.
CMP : 801.2
A good chance for the stock to move up to 900 and 1000
inverse head and shoulders invalidation occurs below 745

Resistance breakout viewpointAs we see on chart price is continuously retest a level of reistance.
when a price is retracing more times then look for a breakout long trade.
Let's see that price will give target or not.
This trade is for only learning purpose take a risk for your own capital.

KPR MILLS
After facing a rejection at 925 levels the stock retreated to 200 SMA levels. Taking support at the 200 MA level the stock is attempting to bounce back. It has crossed above the 200 and short-term moving averages. It has also crossed above the supply line. The last two bars with wide spread up bars closing up indicating good quality buying. Recent increased delivery volumes also indicated accumulation. Now there is high probability the stock will test the previous PRZ level at 872-925. Other parameters like Relative strength is on the verge of turning positive. Money flow is already positive. Ease of movement will be better once the price moves beyond 802.
