LALPATHLAB - MY STUDY 📊 Script: LALPATHLAB
📊 Nifty50 Stock: NO
📊 Sector: Health Service, Medical/Nursing Services.
This stock pick is according to my study. I have use 4 indicator that is
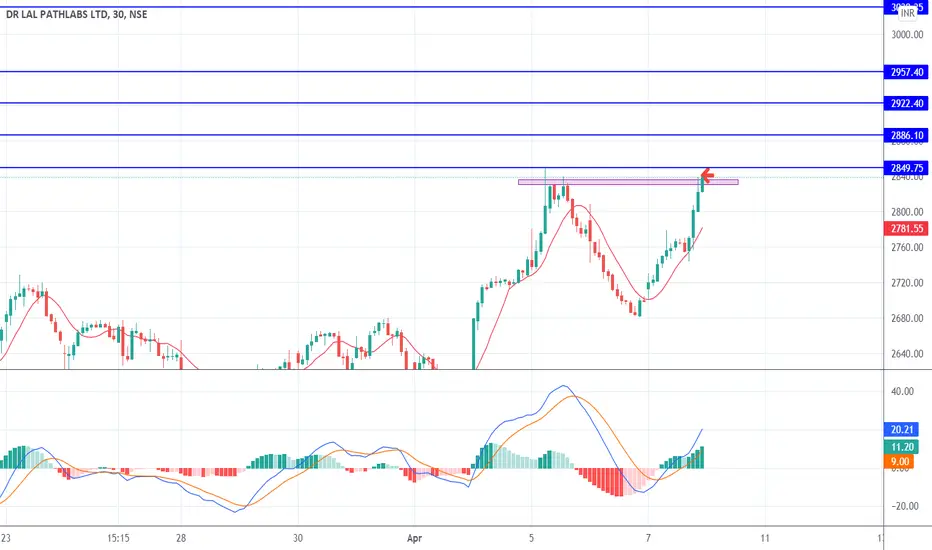
BOLLINGER BAND
MACD
RSI
DOUBLE MOVING AVERAGE
📈 Stock is trading at upper band of BB.
📈 There is MACD crossover.
📈 RSI is around 66.
📈 There is crossover of double moving average.
🟢 Target 🎯🏆 - 2450
⚠️ Stoploss ☠️🚫 - 2216
⚠️ Important: Always maintain your Risk & Reward Ratio.
✅Like and follow to never miss a new idea!✅
Disclaimer: I am not SEBI Registered Advisor. My posts are purely for training and educational purposes.
LALPATHLAB trade ideas

LalpathlabThere seems to be a support but it might not hold because rsi is showing negative divergence

Dr Lal Path Labs India Sun Storm Investment Trading Desk & NexGen Wealth Management Service Present's: SSITD & NexGen Portfolio of the Week Series
Focus: Worldwide
By Sun Storm Investment Research & NexGen Wealth Management Service
A Profit & Solutions Strategy & Research
Trading | Investment | Stocks | ETF | Mutual Funds | Crypto | Bonds | Options | Dividend | Futures |
USA | Canada | UK | Germany | France | Italy | Rest of Europe | Mexico | India
Disclaimer: Sun Storm Investment and NexGen are not registered financial advisors, so please do your own research before trading & investing anything. This is information is for only research purposes not for actual trading & investing decision.
#debadipb #profitsolutions

Dr lalpath lab 1hr tfLook like very good opportunity in upside targets of 2265,2350,2480,2600 and there is very good volume breakout in the stock and comes down was good accumulation upto 2100

Drlalpathlab#drlalpathlab
Strong above 2350
Weak below 2000
Sharing for educational purposes only, i AM NOT SEBI REGISTERED ANALYST.

Everyday with one Equity Intraday Profitable Idea:-Dr LalpathlaTrend Analysis is arguably the most important area of technical analysis and is key to determining the overall direction of a security. Trends are based on the principle of higher highs, higher lows (for an uptrend) and lower highs, lower lows (for a downtrend).
Dr.Lal path lab is now in short term bullish mode in corrective wave pattern. and stands in Resistance area. Expecting bullish momentum, when it will cross 2850 with volume. Please initiate trade after breakout and retesting.
Dr all path lab Buy above 2856.
Target 2870,2880,2890,2915
Positional Target :(BTST):- 2950,3000,3050
Lalpath labs looking positiveAbove 2800, may give a good uprun of 200+.
For education purposes only....!

lalpath labs 1dtflooks like serious selling and if market supports may turn up to trendline of target 3620

LALPATHLABThis stock has recently formed a double top pattern, which is a bearish sign, and also near mediun of depth of same pattern, so if it brokes 3600 levels than we can say that another doors have been opened towards south direction, or we can say towards previous swing lows near 3312. One can go short only below 3600 levels with stop loss of hourly closing above 3642.
All the key levels are mentioned in chart with Stop-loss and Targets.
Key Levels are Mentioned on chart
Overall scenarios
Macd in daily negative crossover
Macd in hourly negative crossover
Rsi in hourly below 40
Disclaimer
I am not sebi registered analyst
My studies are Educational purpose only
Consult with your Financial advisor before trading or investing

Cup and Handle Bullish Pattern9 jan 22
CUP AND HANDLE FORMATION
DR LAL PATH LAB
Bullish Breakout possible
CMP 3750
TARGET 1 4040
TARGET 2 4240

LAL PATHLABS27th December 2021....
Short Term Pick.....(W)
#LALPATHLABS ....
By Above... 3575
Stop loss Below....3310 Closing Basis
Target..... 3840 , 4100


LALPATHLABNSE:LALPATHLAB
Please note that we are not a SEBI Registered Investor Adviser/PMS/ Broking House.
All the contents over here are for educational purposes only and are not investment advice or recommendations
offered to any person(s) with respect to the purchase or sale of the stocks / futures and options.
You are also requested to apply your prudence and consult your advisers in case you choose to act on
any such content available as WE claims no responsibilities for any of your actions or any outcome of
such action

Lalpath labGo long from CMP..... Strong demand zone and forming bullish harmonic xABCD pattern... Immediate expected target 3800 / 4000

future analysis of DR lal path labsSO currently the lal path labs is on a short downward trend (minor trend )
further it can take support on the 3550 -3600 level as it is a level of value SUPPORT . Also a trendline coming from jan 1 it can support on this .
but according to my analyis it will break this current support there is some reasons for it -;
1. on a Monthly chart a good bearish engulfing with a great body is formed so i am considering further bearish trend.
2. vol of this current green candle formed on support is low so its not sustainable .
3. rsi should take supprt on 23.3.
4. so as according to history repeat itself concept in sept profit booking occurs. so i am bearish onto 3500 level
THESE ARE ALL MY ANALYIS AND I CAN BE WRONG
HAPPY TRADING

Bullish ABCD 1H LalpathlabBullish ABCD seen on lal path lab
PRZ 3738
Price is seen to change direction.
T1- 3815
t2- 3862
t3- 3899
SL- 3686

Technical Ananlysis of LAL PATH LANS on differnt time frames ON a Monthly chart : It has followed succesfully evening star kind of pattern you can see on the monthly charts of it with good volume .So, on a monthly basis it is bearish to sideways as further pain is there .It also has broken a important upward trend line .
On WEEkly basis on chart: As a trend line is broken on monthly chat it can be clearly shown in weekly chart with good volume from the previous candle. from top it is rejected by the same level as rejected earlier on 30th of august making that a strong rejection zone (4247.80).
ON daily chart:
It is making a double top kind of pattern whose bottom is recently broken again with good rising volume making the breakdown a more prominent and effective one. this breakdown is also associated with uptrend breakdown .candles are also good as it made a long bearish engulfing candle (full good body) at the top which confirms the that bears are strong.
also on RSI ; its showing a bearish divergence .
on stochastic ;its showing an crossover of red line over bluee line meaning power of bear are increasing.
ON 1 HOUR chart:
double top pattern breakdown
if we draw a fibo from 17th day high to low the price is getting rejected from 50percent and is still not broken the low
IN my opinion and through analyis if it had to broke the low it should have done it on the same day but the low is not broken .Also a hammer pattern is made at the low .
RSI ON OVERSOLD region can take support from 28 can bounce back also the STOCHASTIC OSICLLATOR IS ON OVERSOLD REGION.
SO ON END I WANT TO SAY THAT THE TREND IS BECOMING A BIT BEARISH ACC. TO MONTHLY CHART BUT NOT SO BEARISH.
ON MONDAY IF IT OPEN GAP DOWN LIKE WE CAN SAY ON 1HOUR CHART IF IT OPENS BELOW THE PREVIOUS DAY LOW BULLISH MOMENTUM WILL OCCUR IF OPENS GAP UP IT CAN GO FOR A RETEST KINDA THING . SO LETS OBSERVE
AND YES THESE ARE ALL MY ANALISIS AND I CAN BE WRONG SO TRADE ACCORDINGLY
HAPPY TRADING

LALPATHLAB LONGBuy above 3986
Targets 4020/4240/4400
SL 3793
It is currently looking good to me for a swing.


pathlab analysis om 15 mion time framepath lab analysis on 15 min time frame if stock break downtrend line go on bullish site.

Buy DrLALPATHLAB Target 🎯 4400Buy DrLALPATHLAB Target 🎯 4400 because it's recently given major breakout.

