LATENTVIEW trade ideas

LATENTVIEWLATENTVIEW
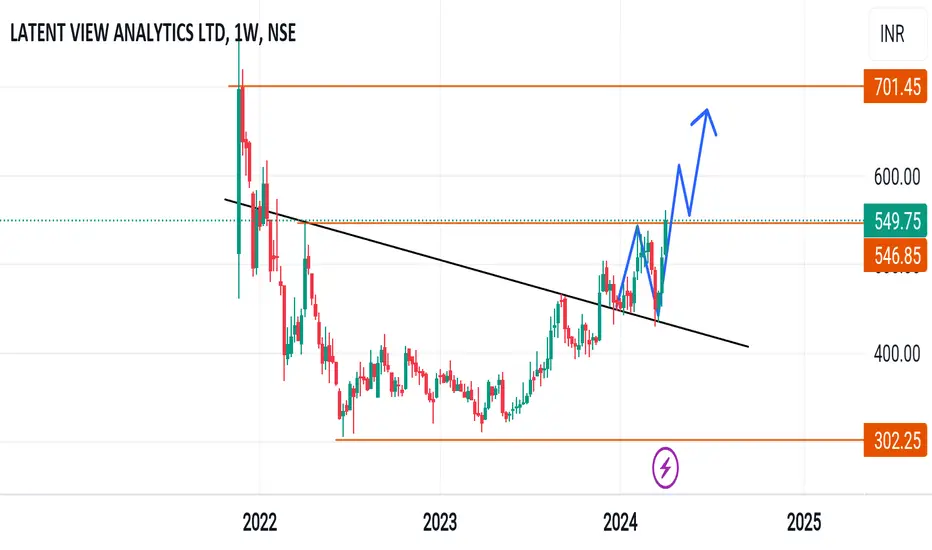
watch above levels. green line is our entry, redline is our SL.
DISCLAIMER : I am NOT a SEBI registered advisor or a financial adviser. All the views are for educational purpose only.

Good order block momentum Zone Buy Cmp first target 560 if first target break next target 700
Stoploss 450
Holding period 5-15 days for first target
Holding period 2-3 months for second target

POTENTIAL LONG OPPORTUNITY IN LATENTVIEW AFTER GOOD RESULTSLATENTVIEW has reported a 34% rise in Y-o-Y Sales and 17% rise in Y-o-Y Profits.
PRICE ACTION:
WEEKLY: Stock is trading within a range.
DAILY: Stock has broken out of a downward trendline.
RATIONALE: The good quarterly results might act as trigger point in pushing the price up to the previous resistance. Not much of selling pressure is seen in the red candles. There are significant green candles in the range. This suggests that the stock is in the accumulation stage.
Targets and Stoploss are marked in the chart.
DISCLAIMER: This is shared for educational purposes only and not a recommendation to BUY/SELL. Please do your own research before taking a decision.
Happy Trading!

LATENTVIEW Daily breakout Strong LATENTVIEW has given Daily breakout Strong with Volumes
Nearest Target 528/550 Expecting

LAtent view looks gooodlatent view looks good above on buy 500 SL 430 target is 1st target is 600-640

Watch Out for LATENTVIEWLATENT VIEW looks bullish from here, One's interested can open long positions above 485 and keep stoploss below previous swings.
Expecting All Time High from here.

SWING IDEA - LATENT VIEW ANALYTICSIn the dynamic realm of market opportunities, Latent View Analytics emerges as a compelling prospect, poised for an upside rally.
Reasons are listed below :
After multiple tests at the crucial 500 level, Latent View Analytics is currently positioning for a decisive breakout.
Robust bullish marubozu candles, both on the weekly and daily timeframes, signal a strong upward momentum. Notably, the weekly candle engulfs the preceding six weeks, emphasizing sustained buying interest.
An upswing in volumes accompanies the bullish trend, indicating heightened market participation and conviction.
Breaking free from a solid two-year consolidation phase, Latent View Analytics signals a shift from stagnation to potential growth.
Target - 545 // 573 // 618
Stoploss - weekly close below 443
DISCLAIMER -
Decisions to buy, sell, hold or trade in securities, commodities and other investments involve risk and are best made based on the advice of qualified financial professionals. Any trading in securities or other investments involves a risk of substantial losses. The practice of "Day Trading" involves particularly high risks and can cause you to lose substantial sums of money. Before undertaking any trading program, you should consult a qualified financial professional. Please consider carefully whether such trading is suitable for you in light of your financial condition and ability to bear financial risks. Under no circumstances shall we be liable for any loss or damage you or anyone else incurs as a result of any trading or investment activity that you or anyone else engages in based on any information or material you receive through TradingView or our services.
@visionary.growth.insights


Latent View Analytics LtdTarget and SL given in chart
Stock valuations are not cheap - Keep Strict SL
OLD CHART IDEA
FUNDAMENTALS
Market Cap
₹ 11,320 Cr.
Current Price
₹ 550
High / Low
₹ 561 / 322
Stock P/E
76.7
Book Value
₹ 62.1
Dividend Yield
0.00 %
ROCE
16.7 %
ROE
13.8 %
Face Value
₹ 1.00
Price to book value
8.85
Intrinsic Value
₹ 119
Price to Sales
18.6
Debt
₹ 24.8 Cr.
Debt to equity
0.02
Int Coverage
63.5
Reserves
₹ 1,259 Cr.
Promoter holding
65.4 %
Pledged percentage
0.00 %
EPS last year
₹ 7.59
Net CF
₹ -183 Cr.
Price to Cash Flow
116
Free Cash Flow
₹ 94.2 Cr.
OPM last year
26.9 %
Return on assets
13.0 %
Industry PE
35.3
Sales growth
18.4 %

Latent view: Bears in disguise of Bulls?We may see an Invert H&S formation which looks like it has already broken out, but we still need a confirmation as this may be a fake out instead, currently we need a continue green candle which can take the RSI to 70.5 or above without falling. This will confirm the BO and counter may reach its all time high, if it fails to do so, we may see a sharp fall.

Lantenview Weekly Chart IPO strategyRound bottom pattern
volume grwoth
bolinger band
rsi
ema
all are above (hold the breath adn long)

LATENTVIEW Cup & Handle Pattern on Weekly ChartLATENTVIEW has formed a Beautiful "Cup & Handle Pattern" on weekly chart its CMP is 512 expecting 620 mark in max 4-6 months. However the IT sector is near by to All Time High and mostly there is a probability to break ATH in this Feb 2024.

Latentview : Symmetrical WedgeAfter hitting all three of our previous targets the NSE:LATENTVIEW is currently exhibiting characteristics of a symmetrical wedge pattern, indicating a potential period of consolidation and indecision in the market. A symmetrical wedge pattern is identified by two converging trendlines, both sloping inwards. This formation signifies a period of decreasing volatility and tightening trading ranges as the highs and lows of the price action gradually converge. The symmetrical wedge pattern is considered a continuation pattern, implying that the prior trend, in this case, the prolonged upside run, could resume after the pattern's completion.
Breakout Strategy:
To effectively capitalize on this pattern, traders should exercise patience and wait for a confirmed breakout from the symmetrical wedge formation. A breakout occurs when the price decisively moves above or below one of the trendlines, accompanied by significant volume, signaling a shift in market sentiment.
Confirmation and Risk Management:
It's crucial to wait for confirmation of the breakout and avoid preemptive entries. Additionally, traders should implement proper risk management techniques, such as setting stop-loss orders to mitigate potential losses in case of a false breakout or adverse price movement.
Conclusion:
In summary, the formation of a symmetrical wedge pattern after a long upside run on the NSE:LATENTVIEW chart suggests a period of consolidation and indecision in the market.

LATENT VIEWDOUBLE bottom confirm on weekly time frame . followed by gud volume. also above 20 MA. which is very important for any move to sustain. it may be gud buy at this price point. because it has great subscription during IPO. now if it is giving break out here. there may be gud upside from here.

LATENTVIEWThe had moved out of a long consolidation moved out of the consolidation zone last November. Then again after two months of consolidation moving up again to the next step. Good volume support also seen. Relative strength and Money Flow is also positive indicating possible further up move.

LATENTVIEW
Coming out of Stage - 1.
Stock is attracting DIIs.
Stage - 2 - Break out followed by weekly volume support.
Expecting good move keeping Nov low as SL

Latent View Analytics LtdObserved Breakout with Volume
Target and Stoploss in chart
Market Cap
₹ 8,867 Cr.
Current Price
₹ 433
High / Low
₹ 434 / 310
Stock P/E
56.6
Book Value
₹ 58.9
Dividend Yield
0.00 %
ROCE
16.7 %
ROE
13.8 %
Face Value
₹ 1.00
Promoter holding
65.7 %
EPS last year
₹ 7.59
EPS latest quarter
₹ 1.60
Debt
₹ 21.5 Cr.
Pledged percentage
0.00 %
Net CF
₹ -183 Cr.
Price to Cash Flow
91.0
Free Cash Flow
₹ 94.2 Cr.
Debt to equity
0.02
OPM last year
26.9 %
OPM 5Year
28.4 %
Reserves
₹ 1,187 Cr.
Price to book value
7.36
Int Coverage
69.2
PEG Ratio
Price to Sales
15.6
Market Cap to Sales
15.6
Qtr Profit Var
4.38 %

Latent View - Coming out of a year long consolidationLatent View is breaking out of year long consolidation. First target will be 460 followed by 510. Todays closing above 405 will suggest breakout of consolidation.
Cheers.
PS: for education purpose only.

Latent View near to breakout on Weekly chartCurrently stock is testing its multi-weekly resistance.
Volume increase can be seen.
After taking strong support at 320 level, stock is making higher lows
A rally can come above 510-520 levels

Latentview - Longterm Investment*Latentview CMP - 472.50 / Positional Trade*
*Buy Between 470 - 473 RS Range / Strict Stop Loss 449*
Target 1 - 500
Target 2 - 540
Target 3 - 600
Target 4 - 650
Target 5 - 700 +
Disclaimer: This is my view and for educational purpose only.

LatentvieThese are swing ideas which you can add your watchlist and analysis for yourself !
Keep on your radar!
This content only education purpose!
❗I am not sebi ragister❗
