LICHSGFIN trade ideas

LIC HOUSING FINANCE AT KEY SUPPORT ZONE.This is the 4 hour chart of LICHSGFIN.
LICHSGFIN is trading near it's support zone at 600 range.
If this level is sustain,then we may see higher prices in stock.
Thank You !!

Strong reversal seen in LIC HSG FIN ????Hi Guys !
• As it is clearly visible from the chart that in downtrend LIC Hsg fin has formed inverse H&S, not only formed but it has break the neckline also with good volume.
• Now to participate in rally wait for another green candle which will also called confirmation candle.
•Once it confirms then enter the trade and target will be 20%-21% from the first broken candle.
• Don't get confuse between target and entry should be after 2nd confirmation candle.
• Stoploss will be low of right shoulder which will be 10%-11%.
***This are all my personal views and thoughts and not any recommendations***

Long formation Inverse H&SFormation - Inverse H&S
Long Pattern Confirmation
Sector - Housing Finance Companies
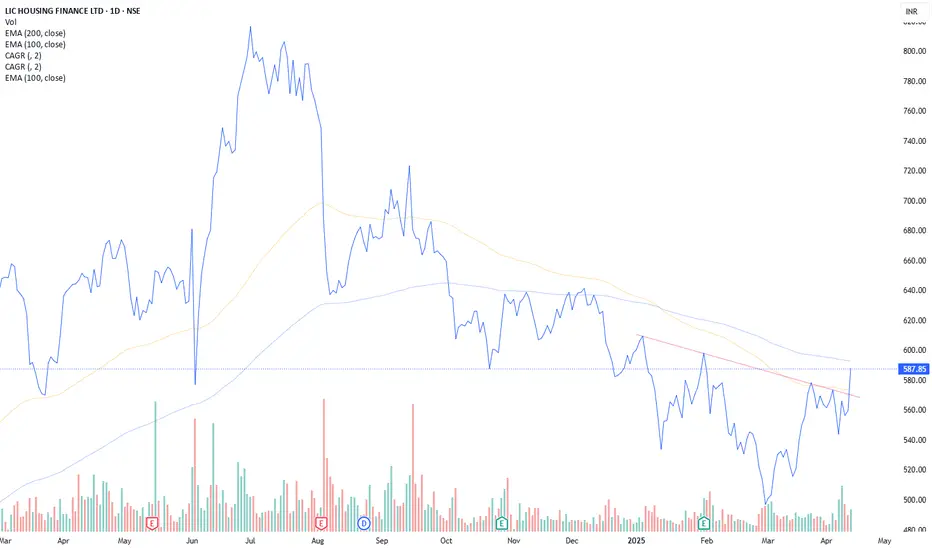
LICHOUSINGFINANCE LICHSGFIN Will face resistance around 620 and it will start its downword journey towords 454, lets watch it

LIC HOUSING FINANCEThe idea has been explained in chart on technical basis.
This chart is for knowledge purpose only and is not a recommendation for buying.
Kindly follow strict stoploss and consult your financial advisor before investing.
Happy Trading..
Disclosure : I have invested in this stock from 580 level.

lic housing financehas accepted bids worth 13.15 billion rupees ($155.7 million) for the sale of bonds maturing in three years, three bankers said on Friday.
The company will pay a coupon of 7.75% for this issue and had invited bids from bankers and investors on Thursday


LONG6 year cup, crossed the resistance, retested no. ready to move up. Vol positive Likey target 1075 . Your money your risk. Its not a buy recommendation. Consult your Fin advicer.

LICHSGFINLIC HOUSING FINANCE LTD Trading at major support and took support from there so stock will move further upside TGT is ATH resistance if breakout that resistance level TGT up to 1X
and this analysis just for educational purpose only

#LICSGFIN Rounding Bottom BO 7Yr WTF/MTF#LICSGFIN Rounding Bottom BO
The Stock Closed above the 7year High in the 1st Week of July. Its in a Pullback since then.
Start Accumulation in small quantities @780 800...
Add 50% qty above 815
TGT 883, 919...
SL 750

LIC HOUSING FINANCE (for 1-2 Quarters)Stock retraced from its life time high.. currently trading at 651 which is 21% down from the higher levels.
As per Fibonacci levels.. the stock is in reversal zone. since the broader markets are correcting due to weak global cues.. this may see further fall and touch 605 to 542 levels
As a long term investment this can be accumulated in this zone and wait for 1-2 quarters for further growth
some body who is already carrying positions can continue to hold and add more in dips
First Target - 826
Second Target - 962
Third Target - 1180
Stop-loss - 446 (This is highly unlikely but keep this level in mind for exit)
This idea is just for education and analysis purpose only and not for real time investment.. kindly consult your financial adviser before taking investment decision

LIC Housing Finance LtdLIC Housing Finance Limited is a housing finance company registered with National Housing Bank (NHB) and is mainly engaged in financing purchase / construction of residential
flats / houses to individuals and project finance to developers, Loan against Property (LAP), Lease Rental Discounting (LRD)for commercial properties as well as purchase of commercial shops/showrooms.
TARGETS MENTIONED IN CHART - SL 373
Market Cap
₹ 22,742 Cr.
Current Price
₹ 413
Stock P/E
7.87
Book Value
₹ 494
Dividend Yield
2.06 %
ROCE
7.57 %
ROE
11.1 %
Face Value
₹ 2.00
Promoter holding
45.2 %
EPS last year
₹ 52.6
EPS latest quarter
₹ 21.6
Debt
₹ 2,44,913 Cr.
Pledged percentage
0.00 %
Net CF
₹ -183 Cr.
Price to Cash Flow
-1.16
Free Cash Flow
₹ -19,673 Cr.
Debt to equity
9.01
OPM last year
87.0 %
OPM 5Year
89.3 %
Reserves
₹ 27,075 Cr.
Price to book value
0.84
Int Coverage
1.22
PEG Ratio
1.04
Price to Sales
1.00

LICHSGFINLICHSGFIN is currently trading around its all-time high (ATH) and presents an opportunity for a long trade with a promising risk-reward profile. The strategy involves entering a position at 4% above the ATH and employing a dynamic stop-loss approach to manage risk and maximize potential gains.
Entry: Enter a long position at LICHSGFIN's ATH price + 4% (825.75)
Initial Stop-Loss: Set an initial stop-loss at 20% below the entry price (660.60) or Weekly Swing Low
Targets:
First Target: 1,170.20 (Fibonacci 1.618 level)
Second Target: 1,402.75 (Fibonacci 2 level)
Third Target: 2,011.50 (Fibonacci 3 level)
Position Sizing: Limit the trade size to ensure that no more than 5% of your capital is at risk. In case the stop-loss is triggered, the maximum capital loss will be limited to 1%
The dynamic stop-loss adjustment after reaching the first target further protects capital and locks in profits.
The position sizing ensures that you are not risking more than you can afford to lose.
Disclaimer:
This trading strategy is for informational purposes only and should not be construed as financial advice. Please conduct your own research and due diligence before making any trading decisions.
Additional Notes:
Consider using technical indicators and chart patterns to refine your entry and exit points.
Monitor market conditions and adjust your strategy accordingly.
Practice risk management techniques to protect your capital.
Please let me know if you have any other questions.

LIC Housing Finance Intraday level fo 26th June #LICHSGFIN LIC Housing Finance Intraday level fo 26th June #LICHSGFIN
Buying opportunity above 776
Stop Loss area 765
Charts for Educational purposes only.
Please follow strict stop loss and risk reward if you follow the level.
Thanks,
V Trade Point

LIC Housing fin chart analysisLIC Housing fin chart analysis on monthly time frame. Please follow for more

LICHSGFINView : Swing / Positional
Nice base formation, chart looks positive.. likely to start its upward journey, having two resistance at top, but a kind of preempted entry setup for me.
Disclaimer : sharing my knowledge, no BUY/SELL recommendation

LIC HOUSING FINLIC HOUSING BREAKOUT
LIC IN BREAKOUTED IN 2 RESISTANT AREA.
stock is up trend
FANFUNDMENTALLY A good stock and low VALUATION
set stop loss 5%

Head and shoulder formation on LICHSGFINLICHSGFIN is forming what that appears to be a reverse head and shoulder pattern on daily chart. Stock has been on a steady uptrend for more than a year now. Note the run up prior to formation of head and shoulder pattern with good volume. Also during selloff there wasnt much volume indicating sellers are dried out. On the right shoulder there was a hammer pattern formation forming a good support if entered at right price after breakout. Bullish finish today indicates there is more buying to come. However wait for a strong close before entry.
Hope you liked this idea. If you like please boost this idea or leave a comment down on what you think. Otherwise, happy trading :-)

LICH finance BreakoutCup handle breakout on weekly time frame ..Very bullish technical as well as fundamental
Target 500/530/600..12 month time

LICHSGFINAfter a quick fall, LICHSGFIN is currently holding at a resistance level. Once it breaks this level, it may show good momentum.

LIC HOUSINGheading toward 647-52 range for target of 3rd/C wave in hourly chart. We have a long term target of above 850 and stock may make a new high in 2024-25 ( above 850 range). in 5th wave of weekly chart.

LIC Housing Finance: Is it tracing back the history.!!Observations:
I can see the LIC Housing Finance has broke out of its yearly resistance.
Zooming out, Surprised to witness that, the stock is nearly at the same structure (technically) where it was in 2014. As if it is retracing.
In 2014 after its breakout hits the 500 round figure and corrected.
Now I can presume the 1000 round figure would do the same.
If its financials back-it-up strongly, there is no wonder the price will retrace its pattern once again.
One can see the wedge (ASCENDING BOARDING WEDGE) of LIC, playing out (3rd leg) nicely...
Clarification on Markings:
x: pole has double to: 2x
xyz: pole .......?
