LODHA | Buy @LTP | Small SL below 1550 | Target 1800Disclaimer:
This is not financial advice. Please do your own research or consult with a financial advisor before making any investment decisions. Investments in stocks can be risky and may result in loss of capital.
LODHA trade ideas
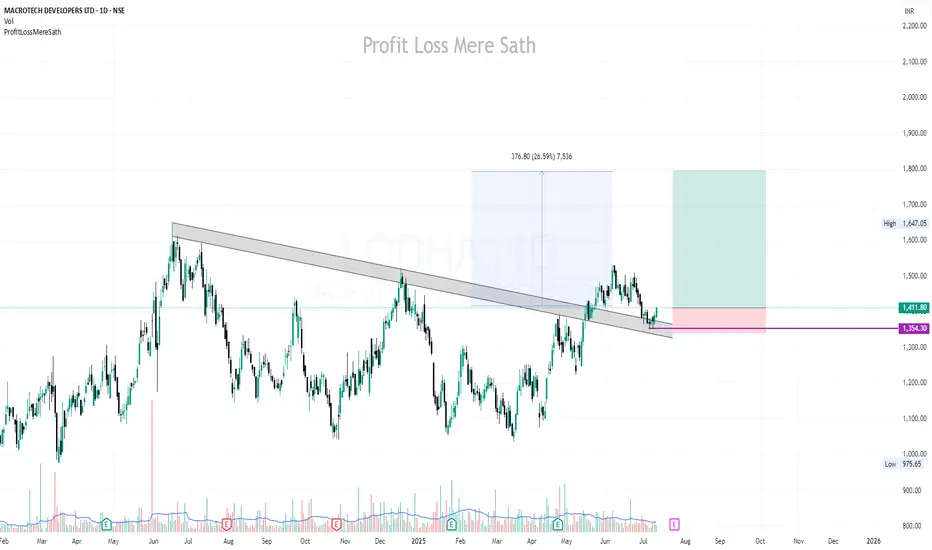
Keep an eye on Lodha (Macrotech Dev.)Lodha looks good for positional trading I am entering above 1535 for 1975. My SL is below 1375 WCB


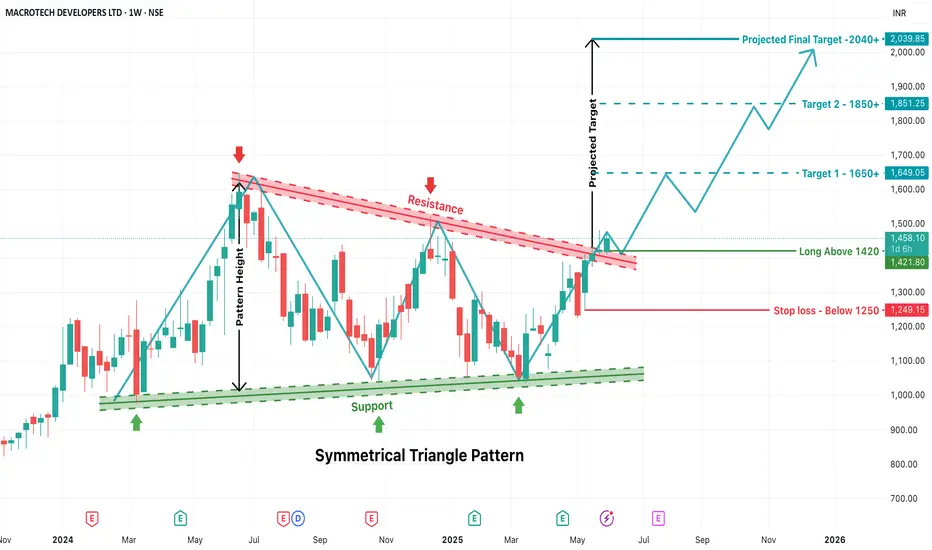
LODHA - Symmetrical Triangle Breakout Trade SetupAbout Pattern:
A Symmetrical Triangle Pattern is a continuation chart pattern formed when price action creates lower highs and higher lows, converging toward a point. It reflects indecision and compression in price before a breakout occurs. The breakout can be on either side, but here, a bullish breakout has occurred.
Support Line: Formed by connecting the swing lows (green arrows), which are gradually increasing.
Resistance Line: Formed by connecting the swing highs (red arrows), which are gradually decreasing.
This convergence of support and resistance forms the triangle.
Breakout Confirmation
Breakout Level: ₹1420
The stock has clearly broken out above the resistance trendline, indicating a strong bullish signal on the weekly timeframe.
Entry and Stop Loss Strategy
Entry Point: Enter the trade only above ₹1420 after confirmation of breakout. This acts as a psychological and technical barrier.
Stop Loss (SL): Set below ₹1250, which is well below the previous swing lows and triangle support. This acts as a safety net in case of a false breakout or reversal.
Target Calculation – Based on Pattern Height
Pattern Height:
Calculated from the highest swing high inside the triangle to the lowest swing low.
This vertical distance is then added to the breakout point (₹1420) to estimate the price targets.
Target 1: ₹1650+
This is the first resistance zone post-breakout and a psychologically important round number.
Target 2: ₹1850+
Based on the full extension of the pattern height and intermediate resistance zone.
Final Projected Target: ₹2040+
This is the complete projection of the triangle pattern height.
This setup is suitable for:
Swing traders looking for positional opportunities
Investors seeking breakout confirmation for fresh entries
Trend followers waiting for consolidation breakouts
Once price sustains above ₹1420, the stock is expected to follow a bullish trajectory toward ₹1650–2040+ over the coming weeks/months.
LODHA - LONGNSE:LODHA Year with effect of Mars and in numerology also 2025 is the year for Mars- reflect the good momentum in realty sector. Also weekly chart showing buyers at location.

LODHA - Bearish due to forming double Top pattern
TECHNICAL INDICATORS -
DOUBLE TOP PATTERN formation -
NSE:LODHA has formed a double top pattern indicating strong downward pressure for the stock
Double top is characterized by two consecutive peaks on a price chart, with a dip or low between them & subsequent breakout
VOLUME SPIKE -
the stock has recently shown two large volume spikes indicating strong upcoming momentum for the stock
Generally volumes increase before a significant price movement
SHOOTING STAR candlestick -
the stock has formed a shooting star candlestick recently indicating trend reversal for it ie from upward movement to downward movement
Shooting star is characterized by a small body at bottom and a long upper shadow of a candlestick
GAP-DOWN BREAKOUT -
the stock has broken out of the pattern with a gap-down indicating very strong downward pressure
PROFIT TARGET -
1200
STOP LOSS -
1325

LODHA | Buy @LTP | Strict SL below 1250 | Target 1523,1650,1950Disclaimer:
This is not financial advice. Please do your own research or consult with a financial advisor before making any investment decisions. Investments in stocks can be risky and may result in loss of capital.

Macrotech Developers LODHA analysis1. Trend :
• The stock is in an uptrend over the observed period, as shown by higher highs and higher lows.
• The price is trading above key moving averages (e.g., 50-day, 100-day, 200-day), which act as support levels.
2. Support and Resistance :
• Support Levels:
• ₹1,408.35 (near the current price level).
• ₹1,325.32 and ₹1,297.80 are additional lower support zones.
• Resistance Levels:
• ₹1,495.70 and ₹1,441.35 are significant resistance areas.
3. Indicators :
• Relative Strength Index (RSI):
• RSI is currently around 56, suggesting the stock is in a neutral zone but closer to overbought conditions in recent weeks.
• A decline from overbought levels indicates a short-term consolidation or minor correction.
• Volume:
• The volume has been steady, with a notable spike during specific rallies, signaling strong buying interest.
• Volume Delta
If volume delta turns positive while the stock approaches the ₹1,441-₹1,495 resistance zone, it could lead to a breakout.
• A negative delta near current support (~₹1,408) would indicate caution, as sellers may dominate, pushing the stock lower.
4. Key Observations:
• The stock is showing consolidation near a resistance level of ₹1,408.35.
• The upward sloping trendline (marked in blue) suggests strong buyer support.
• If the stock breaks above ₹1,495.70, it could resume its uptrend.
5. Outlook :
• Bullish Scenario: A breakout above ₹1,495.70 with strong volume may take the stock toward ₹1,650 levels.
• Bearish Scenario: A fall below ₹1,408.35 may lead to a test of the ₹1,325.32 support.

LODHA Swing TradeHello,
Trend-Based Analysis. Buy the Dips, Sell The Rallies, Also Following the Trend. Let's see where the Price Action takes us, Riding the wave. Potential trade setups based on trend momentum.
Technical analysis based on trend identification and momentum, Looking for high-probability setups within the prevailing trend.
Analyzing the current market trend and potential future price movement. Focusing on risk management and reward-to-risk ratios.
Details is Mentioned in Chart, Read carefully.. .

LODHA DEVELOPERSLODHA DEVELOPERS looks to be in its 5 th wave
4th wave retraced around 38.2% of 3rd wave
Rsi hidden bullish divergence shows chance of 5Th wave going up.

LODHA S/R Support and Resistance Levels:
Support Levels: These are price points (green line/shade) where a downward trend may be halted due to a concentration of buying interest. Imagine them as a safety net where buyers step in, preventing further decline.
Resistance Levels: Conversely, resistance levels (red line/shade) are where upward trends might stall due to increased selling interest. They act like a ceiling where sellers come in to push prices down.
Breakouts:
Bullish Breakout: When the price moves above resistance, it often indicates strong buying interest and the potential for a continued uptrend. Traders may view this as a signal to buy or hold.
Bearish Breakout: When the price falls below support, it can signal strong selling interest and the potential for a continued downtrend. Traders might see this as a cue to sell or avoid buying.
20 EMA (Exponential Moving Average):
Above 20 EMA(50 EMA): If the stock price is above the 20 EMA, it suggests a potential uptrend or bullish momentum.
Below 20 EMA: If the stock price is below the 20 EMA, it indicates a potential downtrend or bearish momentum.
Trendline: A trendline is a straight line drawn on a chart to represent the general direction of a data point set.
Uptrend Line: Drawn by connecting the lows in an upward trend. Indicates that the price is moving higher over time. Acts as a support level, where prices tend to bounce upward.
Downtrend Line: Drawn by connecting the highs in a downward trend. Indicates that the price is moving lower over time. It acts as a resistance level, where prices tend to drop.
RSI: RSI readings greater than the 70 level are overbought territory, and RSI readings lower than the 30 level are considered oversold territory.
Combining RSI with Support and Resistance:
Support Level: This is a price level where a stock tends to find buying interest, preventing it from falling further. If RSI is showing an oversold condition (below 30) and the price is near or at a strong support level, it could be a good buy signal.
Resistance Level: This is a price level where a stock tends to find selling interest, preventing it from rising further. If RSI is showing an overbought condition (above 70) and the price is near or at a strong resistance level, it could be a signal to sell or short the asset.
Disclaimer:
I am not a SEBI registered. The information provided here is for learning purposes only and should not be interpreted as financial advice. Consider the broader market context and consult with a qualified financial advisor before making investment decisions.

SWING IDEA - MACROTECH DEVELOPERS (LODHA)Macrotech Developers , a prominent real estate company in India, presents a swing trading opportunity based on its current technical setup.
Reasons are listed below:
1200 as a Strong Support Zone : The 1200 level has been a significant support zone, providing a strong foundation for a potential upward move.
Double Bottom Pattern on Daily Timeframe : A double bottom pattern has formed on the daily chart, which is a classic bullish reversal pattern, indicating the potential for an upward trend after testing the support zone twice.
50 EMA Support on Weekly Timeframe : The stock is finding support at the 50-week exponential moving average, which often acts as a strong support level, reinforcing the bullish sentiment.
200 EMA Support on Daily Timeframe : The 200-day exponential moving average is also providing strong support on the daily chart, indicating the long-term trend remains intact.
0.382 Fibonacci Support: The stock has bounced off the 0.382 Fibonacci retracement level, suggesting that the current price level is a strong support area, and there may be further upside potential.
Target - 1415 // 1600
Stoploss - weekly close below 1100
DISCLAIMER -
Decisions to buy, sell, hold or trade in securities, commodities and other investments involve risk and are best made based on the advice of qualified financial professionals. Any trading in securities or other investments involves a risk of substantial losses. The practice of "Day Trading" involves particularly high risks and can cause you to lose substantial sums of money. Before undertaking any trading program, you should consult a qualified financial professional. Please consider carefully whether such trading is suitable for you in light of your financial condition and ability to bear financial risks. Under no circumstances shall we be liable for any loss or damage you or anyone else incurs as a result of any trading or investment activity that you or anyone else engages in based on any information or material you receive through TradingView or our services.
@visionary.growth.insights

Power of 3Good volume build up in daily time frame.
Breakout of 2 months consolidation with good volume.
Price has taken support 3 times from 200EMA.
Fundamentals are good.
FII stakes are up.
NOTE: I do my analysis, do yours before trade.
Eat🍜 Sleep😴 TradingView📈 Repeat 🔁

$macrotechdevelopersgonna get some of this in the morning
invalid back below range low which is quite a bit away from here
so keeping the 200 ema as my hold the level zone for now
defo going for the first key level then eurphoria kicks in near ath and our last line of defence for the bear's
shall reassess once we approach there depending on the time taken to go up


Macrotech developers (Lodha) leading the reality sectorOne of the leading company in reality sector with promoters having 72% holding and fii also have large holding in the company. Share has bounced back from support zone of 1150 and showing momentum for upwards journey. First target would be 1325 and 1450 second target.

Keep An Eye - LODHA📊 Script: LODHA
📊 Sector: Construction
📊 Industry: Construction
Key highlights: 💡⚡
📈 Script is trading at near its support level keep an eye on stock, we may see some good rally.
📈 One can go for Swing Trade.
⏱️ C.M.P 📑💰- 1239
🟢 Target 🎯🏆 - 1339/1398
⚠️ Important: Always maintain your Risk & Reward Ratio.
✅Like and follow to never miss a new idea!✅
Disclaimer: I am not SEBI Registered Advisor. My posts are purely for training and educational purposes.
Eat🍜 Sleep😴 TradingView📈 Repeat 🔁
Happy learning with trading. Cheers!🥂

LODHA GIVES STRONG BRAKEOUT IN DAILY CHARTNSE:LODHA
LODHA gives double strong brake out in Daily chart.
Buy 1350
SL 1240
Target 1550,1650+
time Duration 1-2 month

VCP in LODHA - 25% up move expected after breakoutMACROTECH DEVELOPERS (LODHA) - is nearing its 52 week high with a dry up in volume on a daily time frame with a consolidation from the past 100 days.
The company has seen an influx of institutional investing in the last quarter.
Good for swing traders to be kept on watchlist. Look for volume gain above the 30w moving average on weekly time frame.
Can expect an upward momentum of a min of 25%.
Entry - INR 1245
SL - 8%
TSL - According to your risk profile.
Disclaimer: Please be advised that the information provided is not intended as financial advice. It is imperative to conduct thorough research before making any investment or trading decisions.

Just A View - LODHA📊 Script: LODHA
📊 Sector: Construction
📊 Industry: Construction
Key highlights: 💡⚡
📈 Script is trading near at resistance level which is 1225 keep an eye on stock we may see some rally.
⏱️ C.M.P 📑💰- 1127
🟢 Target 🎯🏆 - 1293
⚠️ Important: Always maintain your Risk & Reward Ratio.
✅Like and follow to never miss a new idea!✅
Disclaimer: I am not SEBI Registered Advisor. My posts are purely for training and educational purposes.
Eat🍜 Sleep😴 TradingView📈 Repeat 🔁
Happy learning with trading. Cheers!🥂

Macrotech Developers (Lodha) : New listed consistent compounder!5/11 - Jefferies next 5 year companies
Jefferies target by March 2029 - 3,000
Real estate is seeing one of the biggest upcycles and Lodha could be a leader in this segment.


In-Depth Analysis of LODHA (NSE: LODHA)Technical Overview:
1. RSI Divergence and Weekly Chart Support:
LODHA's weekly chart indicates substantial support at the Relative Strength Index (RSI) divergence. RSI is a crucial momentum indicator, and divergence can signal potential trend reversals. The presence of RSI support on the weekly chart suggests a strong technical foundation.
Fundamental Highlights:
1. Q3 Earnings Performance:
Lodha reported robust Q3 earnings with a significant increase in EBITDA, reflecting commendable operational performance. The improved EBITDA margin is indicative of enhanced profitability.
2. Net Profit Growth:
Q3 consolidated net profit has shown substantial growth on both a year-on-year (YoY) and quarter-on-quarter (QoQ) basis. This positive trend in net profit underscores the company's ability to generate earnings.
3. Revenue Expansion:
Q3 revenue growth, both YoY and QoQ, highlights the company's capacity to increase sales, contributing to overall financial strength.
Trade Execution Strategy:
Entry:
Consider entering a long position at the current market price (CMP) of 1056. This entry aligns with the technical support identified on the weekly chart and is further supported by positive fundamental developments.
Stop Loss Placement:
Place a stop loss at 980. This stop loss level is strategically chosen to provide a reasonable buffer against potential price fluctuations while safeguarding the trade from adverse market movements.
Target Setting:
Set a target of 1230. The target is determined based on the technical support and the positive fundamental backdrop, reflecting an anticipated upward price movement.
Risk Factors and Considerations:
1. Market Conditions:
Monitor broader market conditions and potential external factors that may impact the stock or overall market sentiment.
2. Corporate Developments:
Stay informed about any corporate developments, announcements, or industry-specific news that could influence the stock.
3. Continuous Monitoring:
Regularly monitor the trade for any shifts in the technical setup or unforeseen market developments. Be prepared to adjust the strategy based on evolving conditions.
Conclusion:
LODHA presents a compelling opportunity with a combination of technical support and positive fundamental indicators, particularly strong Q3 earnings. The trade is initiated with a comprehensive risk management strategy. Regular monitoring and adaptability are key to navigating dynamic market conditions.
