Next report date
—
Report period
—
EPS estimate
—
Revenue estimate
—
127.40 INR
150.37 B INR
2.55 T INR
1.17 B
About LARSEN & TOUBRO LTD.
Sector
Industry
CEO
Sekharipuram Narayan Subrahmanyan
Website
Headquarters
Mumbai
Founded
2007
ISIN
INE018A01030
FIGI
BBG000CVM9Q5
Larsen & Toubro Ltd. is an investment holding company, which engages in technology, engineering, construction, manufacturing, and financial activities. It operates through the following business segments: Infrastructure, Hydrocarbon, Power, Heavy Engineering, Defence Engineering, IT and Technology Services, Financial Services, Development Projects, and Others. The Infrastructure segment is composed of engineering and construction of buildings and factories, transportation infrastructure, heavy civil infrastructure, power transmission and distribution and water and renewable energy projects. The Hydrocarbon segment provides engineering procurement, construction and commissioning solutions for the global oil and gas Industry from front-end design through detailed engineering, modular fabrication, procurement, project management, construction, installation and commissioning. The Power segment includes turnkey solutions for coal-based and gas-based thermal power plants including power generation equipment with associated systems and balance-of-plant packages. The Heavy Engineering segment manufactures and distributes custom designed, engineered critical equipment and systems to core sector industries like fertiliser, refinery, petrochemical, chemical, oil and gas, thermal and nuclear power, aerospace and defence. The Defence Engineering segment refers to the design, development, and serial production and through life-support of equipment, systems and platforms for Defence and Aerospace sectors; and design, construction, and repair of defense vessels. The IT and Technology Services segment represents global IT services, digital solutions, and engineering and research and development. The Financial Services segment deals with the provision of retail finance, wholesale finance, and investment management services. The Development Projects segment refers to the roads and transmission projects, the Hyderabad Metro Rail project, and power development projects. The Others segment encompasses realty, smart world, and communication projects, marketing and servicing of construction and mining machinery and parts thereof and manufacture, sale of rubber processing machinery and digital platforms. The company was founded by Henning Holck-Larsen and Soren Kristian Toubro in 1938 and is headquartered in Mumbai, India.
Related stocks
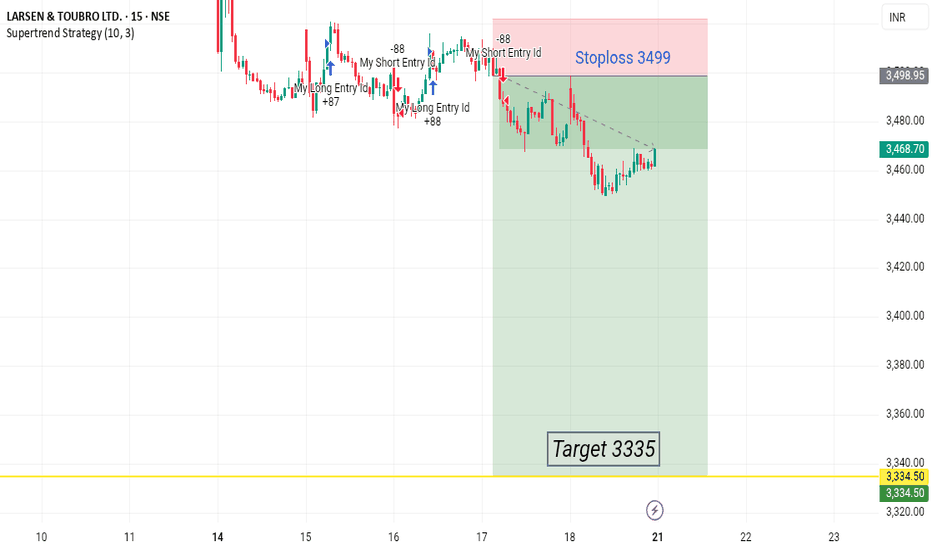
LARSEN📈 Trade Plan
Element Value
Trade Type BUY
Entry Price ₹3477
Stop Loss ₹3284
Risk ₹193
Target ₹4581
Reward ₹1104
RR Ratio 5.7
Last High ₹3960
Last Low ₹2856
🧠 Logic Recap
All timeframes (HTF, MTF, ITF) show a clear uptrend.
Most demand zones align between ₹2856 – ₹3477, showing strong cluster suppo
#LARSEN AND TOUBRO SUPPLY ZONEExplore key supply zones for Larsen and Toubro (L&T) with detailed technical analysis. These zones act as potential resistance levels where price reversals or pullbacks are likely, providing strategic entry and exit points for traders. Perfect for swing trading, breakout strategies, and risk managem
Larsen & Toubro Ltd. | Strong Support Zone & RSI Breakout AlertLarsen & Toubro Ltd. | Strong Support Zone & RSI Breakout Alert 🚀
Price is testing a strong demand zone, showing signs of reversal. RSI is approaching the 52 resistance level—if it breaks above, momentum could shift bullish! 📈
A good risk-reward setup for buyers if the support holds. Watching for
#LT Supply ZoneA LT Supply Zone (Long-Term Supply Zone) in trading refers to a significant price level on a chart where sellers have previously overwhelmed buyers, leading to a strong downward price movement. These zones are identified by areas where price has made a sharp drop after a period of consolidation, ind
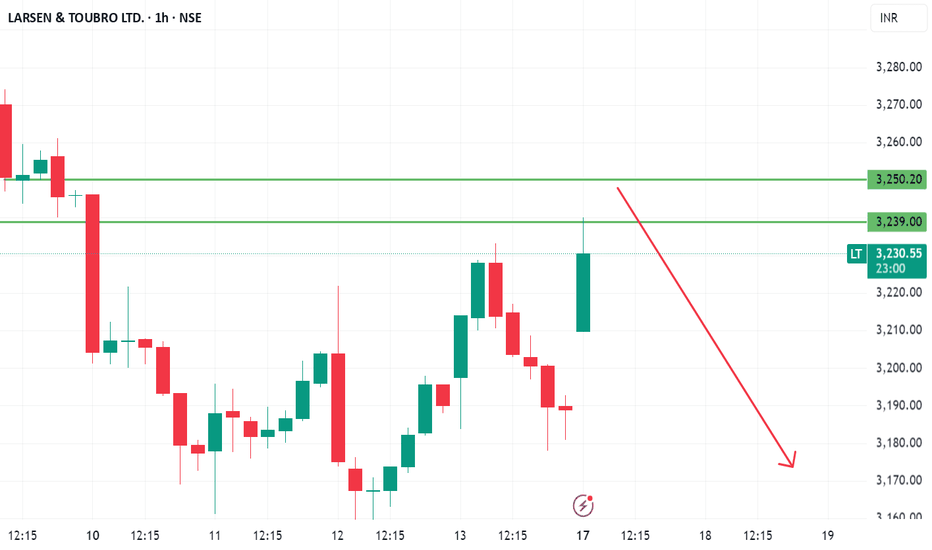
LT | LONG REVERSAL | SWINGLT is showing signs of Reversal on the Hourly chart from the lows.
While this is not a trend change, hence long position needs to be built up only on a short term basis.
Target expected within a week or two - 3400.
Overall long term trend still remains bearish with scope of further correction.
See all ideas
Summarizing what the indicators are suggesting.
Neutral
SellBuy
Strong sellStrong buy
Strong sellSellNeutralBuyStrong buy
Neutral
SellBuy
Strong sellStrong buy
Strong sellSellNeutralBuyStrong buy
Neutral
SellBuy
Strong sellStrong buy
Strong sellSellNeutralBuyStrong buy
An aggregate view of professional's ratings.
Neutral
SellBuy
Strong sellStrong buy
Strong sellSellNeutralBuyStrong buy
Neutral
SellBuy
Strong sellStrong buy
Strong sellSellNeutralBuyStrong buy
Neutral
SellBuy
Strong sellStrong buy
Strong sellSellNeutralBuyStrong buy
Displays a symbol's price movements over previous years to identify recurring trends.
88KTL26
KTL-8.8%-25-4-26-PVTYield to maturity
—
Maturity date
Apr 25, 2026
95KTL40
KTL-9.5%-25-4-40-PVTYield to maturity
—
Maturity date
Apr 25, 2040
95KTL38
KTL-9.5%-25-4-38-PVTYield to maturity
—
Maturity date
Apr 25, 2038
668LTMRH27
LTMRHL-6.68%-30-4-27-PVTYield to maturity
—
Maturity date
Apr 30, 2027
914KTL29
KTL-9.14%-25-4-29-PVTYield to maturity
—
Maturity date
Apr 25, 2029
95KTL36
KTL-9.5%-25-4-36-PVTYield to maturity
—
Maturity date
Apr 25, 2036
95KTL34
KTL-9.5%-25-4-34-PVTYield to maturity
—
Maturity date
Apr 25, 2034
88KTL27
KTL-8.8%-25-4-27-PVTYield to maturity
—
Maturity date
Apr 25, 2027
914KTL28
KTL-9.14%-25-4-28-PVTYield to maturity
—
Maturity date
Apr 25, 2028
95KTL39
KTL-9.5%-25-4-39-PVTYield to maturity
—
Maturity date
Apr 25, 2039
95KTL33
KTL-9.50%-25-4-33-PVTYield to maturity
—
Maturity date
Apr 25, 2033
See all LT bonds
Curated watchlists where LT is featured.

Indian stocks: Racing ahead
46 No. of Symbols
See all sparks
Frequently Asked Questions
The current price of LT is 3,442.90 INR — it has decreased by −0.99% in the past 24 hours. Watch LARSEN & TOUBRO LTD. stock price performance more closely on the chart.
Depending on the exchange, the stock ticker may vary. For instance, on NSE exchange LARSEN & TOUBRO LTD. stocks are traded under the ticker LT.
LT stock has fallen by −1.32% compared to the previous week, the month change is a −5.41% fall, over the last year LARSEN & TOUBRO LTD. has showed a −2.72% decrease.
We've gathered analysts' opinions on LARSEN & TOUBRO LTD. future price: according to them, LT price has a max estimate of 4,550.00 INR and a min estimate of 2,900.00 INR. Watch LT chart and read a more detailed LARSEN & TOUBRO LTD. stock forecast: see what analysts think of LARSEN & TOUBRO LTD. and suggest that you do with its stocks.
LT stock is 1.17% volatile and has beta coefficient of 1.35. Track LARSEN & TOUBRO LTD. stock price on the chart and check out the list of the most volatile stocks — is LARSEN & TOUBRO LTD. there?
Today LARSEN & TOUBRO LTD. has the market capitalization of 4.74 T, it has decreased by −2.03% over the last week.
Yes, you can track LARSEN & TOUBRO LTD. financials in yearly and quarterly reports right on TradingView.
LARSEN & TOUBRO LTD. is going to release the next earnings report on Jul 29, 2025. Keep track of upcoming events with our Earnings Calendar.
LT earnings for the last quarter are 39.95 INR per share, whereas the estimation was 37.18 INR resulting in a 7.45% surprise. The estimated earnings for the next quarter are 26.32 INR per share. See more details about LARSEN & TOUBRO LTD. earnings.
LARSEN & TOUBRO LTD. revenue for the last quarter amounts to 755.27 B INR, despite the estimated figure of 774.76 B INR. In the next quarter, revenue is expected to reach 628.50 B INR.
LT net income for the last quarter is 54.97 B INR, while the quarter before that showed 33.59 B INR of net income which accounts for 63.67% change. Track more LARSEN & TOUBRO LTD. financial stats to get the full picture.
Yes, LT dividends are paid annually. The last dividend per share was 34.00 INR. As of today, Dividend Yield (TTM)% is 0.99%. Tracking LARSEN & TOUBRO LTD. dividends might help you take more informed decisions.
LARSEN & TOUBRO LTD. dividend yield was 0.97% in 2024, and payout ratio reached 26.68%. The year before the numbers were 0.74% and 25.30% correspondingly. See high-dividend stocks and find more opportunities for your portfolio.
As of Jul 27, 2025, the company has 412.97 K employees. See our rating of the largest employees — is LARSEN & TOUBRO LTD. on this list?
EBITDA measures a company's operating performance, its growth signifies an improvement in the efficiency of a company. LARSEN & TOUBRO LTD. EBITDA is 264.35 B INR, and current EBITDA margin is 12.95%. See more stats in LARSEN & TOUBRO LTD. financial statements.
Like other stocks, LT shares are traded on stock exchanges, e.g. Nasdaq, Nyse, Euronext, and the easiest way to buy them is through an online stock broker. To do this, you need to open an account and follow a broker's procedures, then start trading. You can trade LARSEN & TOUBRO LTD. stock right from TradingView charts — choose your broker and connect to your account.
Investing in stocks requires a comprehensive research: you should carefully study all the available data, e.g. company's financials, related news, and its technical analysis. So LARSEN & TOUBRO LTD. technincal analysis shows the strong sell today, and its 1 week rating is sell. Since market conditions are prone to changes, it's worth looking a bit further into the future — according to the 1 month rating LARSEN & TOUBRO LTD. stock shows the neutral signal. See more of LARSEN & TOUBRO LTD. technicals for a more comprehensive analysis.
If you're still not sure, try looking for inspiration in our curated watchlists.
If you're still not sure, try looking for inspiration in our curated watchlists.


