long in larsen and turbo/l&tin daily time frame larsen and turbo gives a support toa trend lline... it it makes big green candle
LT trade ideas

LT LT look like in Extended 3.5, we may see the retrace upto 1500 level from there will start upward move...!!!
L&T braking the downtrendAs per RSI and price diversion ok chart of L&T it will give a good upside move. Target and stoploss is given in chart. After breakout of price stay above trendline then enter. Afterall world market scenario is downside so breakout can be delay but keep eyes on L&T.


L&T stock15 mins time frame :
stock is ready to fly back
1) trading at major support
2) fib correction
3) clear targets

Short LARSEN &TOUBROShort LARSEN & TOUBRO
a monthly chart show it will in the trend line and it will respect the trend line so there was a shorting opportunity

Gem of the week. LT (26/9/21)Today I want to present a GEM in our stock of the week series meant for investors intrested in wealth creation . LT came on my daily chart on 24 May @ 1142. Since then I have recommended this stock multiple times. This week stock has given a unique breakout on weeklychart. If you see, since 2007 stock is trading in a range (red lines) . It has tried to break this level multiple times in a past and took heavy resistance. This week, however, it has able to breach this level successfully. My own target for this stock is 3200 in 2 years . This is a very good entry points for new comers too! 14 years breakout means a lot. This is extremely well techno-funda stock with very low PE. Expert in construction and defense. Each investor should have this stock in his portfolio.
View - Medium to long term.
Time - 2 years
Target - 3200.

Breakout startegy LT gave a breakout in day time frame and we can go long if the same levels sustains

LARSEN & TOUBRO - LT - NSEBiggest infrastructure company in the country.
Decent dividend yield.
Plenty of status quo projects because of covid to be expedited before 2024 elections.
Huge cash in books to be utilized for future growth, organic and inorganic.
No debt, honest management
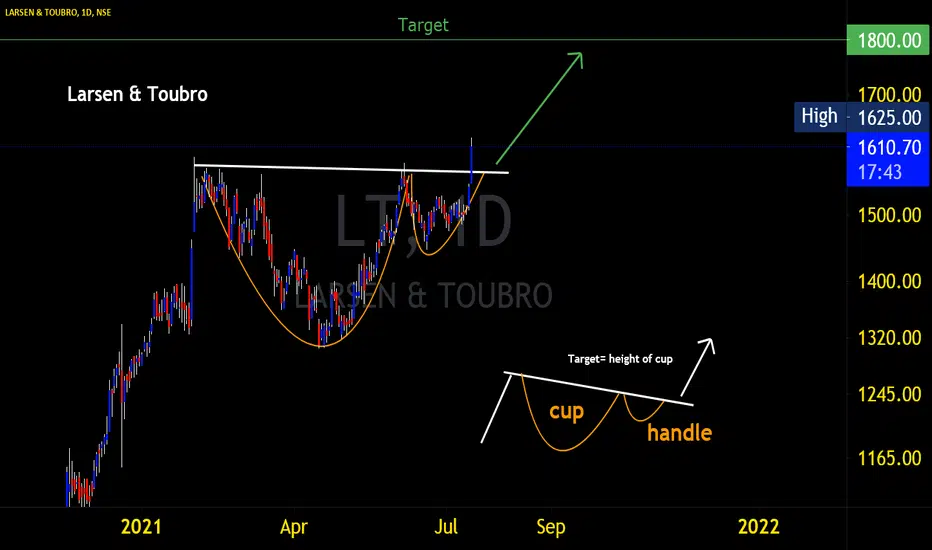
A classic pattern for a quick margin trade with upside for 2200 next 3 quarters.
LONG : L&TGood Breakout of Channel on Daily TF, with good Volume.... LT is now ready for next Flight....

LT Larsen & Toubro - On the moveLT - Larsen & Toubro - On the move after weekly Breakout above 1586. Inverse Head & Shoulder pattern BO seen.
May proceed towards next target of 1870 and pattern target of 2500 in medium term.

L & T Ascending Triangle pattern Ascending triangle pattern - breakout..
An ascending triangle is a chart pattern used in technical analysis. It is created by price moves that allow for a horizontal line to be drawn along the swing highs, and a rising trendline to be drawn along the swing lows. The two lines form a triangle. Traders often watch for breakouts from triangle patterns.
10 - 15 % for short term trade..
Disclaimer: Not a call/buy signal. discussing only chart patterns that I practice.....


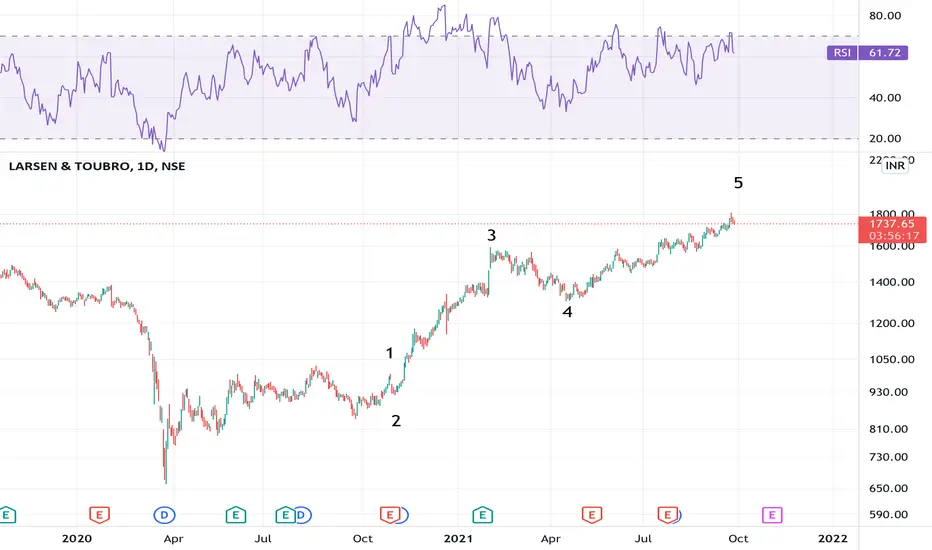
LT - Elliott wave analysis - ending diagonal as 5th upexpecting ending diagonal in 5th wave as overlapping wedge structure

LongLarson seems like bullish side. we can take long above 1718 level and put stop loss below recent structural low.

lt trade set up setting a stop at 1720 lt can be short for 1620. stok has reached its major resistance zone. weekly close above 1720 might indicate new target for 1800.

LT head and shoulder patternL&T heading towards to head target after successful breakout. Take profit to 16%. SL 6%


LT - Elliott wave analysis - corrective price action it is in correction after impulse cycle finished at last high and now expecting sideways to bearish correction down towards 1540. Within correction it can make a new high as overall market sentiment is positive.

Long LTFollow TP1, TP2.
for FnO Sept/Oct buyers ,
Charts say, we are closing september above 1695 and few resistance at 1750 level.
so plan your premium buy levels accordingly!
not a financial advice.
Shared for education purpose only.

LARSEN & TOUBRO 1HRBearish BAT
Wide spread UP BAR closing at high shows Bullish MOMENTUM so will it becomes ABSORPTION Volumes + BREAK OUT to Upside
or
Within 3-5 NARROW SPREAD DOWN BARS Reversal from this level
Set up becomes VALID ONLY with confirmation from a BEARISH CANDLE With NARROW SPREADS & with NO DEMAND & with RSI Below 70
POTENTIAL SELL

its not an recomentation .its my view..target of 1732 its not an recomentation .its my view..target of 1732
