LUPIN : Making or Breaking?1. Key Analysis and Levels
Wave C Completion Zone (₹1946-1982):
The price has reached a potential corrective Wave C termination area, which often acts as a demand zone where buyers re-enter.
This zone is a high-probability reversal region based on Elliott Wave principles.
Stop Loss Level (₹1924):
Positioned below the Wave C correction zone to manage risk in case of further downside.
Protects against potential failure of the demand zone.
First Target Zone (₹2245-2277):
Represents the extended retracement of Wave B and serves as a logical resistance zone for profit booking.
Change of Character (CHoCH):
A CHoCH signal (change from lower lows to higher highs) could confirm the start of a new bullish wave.
2. Trade Setup
A. Long Trade Setup:
Why Long?
The price has reached a critical demand zone (₹1946-1982) with potential for reversal.
The CHoCH zone suggests a possible trend change to bullish.
Entry: Around ₹1980-2000, upon observing bullish price action (e.g., hammer candlestick, engulfing patterns).
Stop Loss: ₹1924, ensuring minimal risk if the correction extends.
Targets:
₹2245-2277: Key resistance zone at the extended retracement of Wave B.
Trailing stops can be used for further upside beyond ₹2277.
B. Short Trade Setup (If Demand Zone Fails):
Why Short?
A strong breakdown below ₹1924 could indicate the demand zone has failed, leading to continuation of the downtrend.
Entry: Below ₹1924 after confirmation of breakdown with volume.
Targets:
₹1850: Immediate support from prior structure.
₹1720-1750: Deeper demand zone.
Stop Loss: ₹1970 to avoid being caught in a false breakdown.
3. Explanation of Analysis
Wave C Completion:
The corrective Wave C often concludes near key Fibonacci retracement levels, aligning with ₹1946-1982 here.
This zone has historical relevance as a demand area.
CHoCH Confirmation:
A breakout and higher high beyond the consolidation range would validate bullish sentiment.
Risk-Reward Dynamics:
Well-defined stop loss and target zones ensure favorable risk-to-reward setups for both long and short trades.
4. Confirmation Signals
For Long Entry:
Price stability and bullish reversal signals (e.g., RSI divergence, bullish engulfing candles) in the ₹1946-1982 zone.
A confirmed breakout above ₹2020 would further validate the trend reversal.
For Short Entry:
A decisive close below ₹1924 with high volume and bearish momentum.
5. Risk Management
Limit risk to 1-2% of your trading capital per trade.
Use scaling techniques to lock partial profits at the first target zone, trailing stop losses for additional gains.
Why This Plan Works
This trading strategy combines Elliott Wave analysis, demand-supply dynamics, and structured price levels to anticipate a potential bullish reversal. It also incorporates a contingency plan for a bearish breakdown, ensuring preparedness for all market scenarios.
LUPIN trade ideas

Safe enter with small stop loss and higher rewards.📊 Equity Analysis: Lupin Ltd.
Current Price: ₹2,036.25
Day's Range: ₹2,036.25 – ₹2,098.00
Previous Close: ₹2,071.40
🔍 Technical Overview
Trend: The stock showed a slight downward movement today, trading at 1.68% lower.
Resistance Levels: ₹2,100 – ₹2,120
Support Levels: ₹2,000 – ₹2,020
📈 Equity Trading Strategy
Entry Point: Consider entering a long position if the stock sustains above ₹2,000 with strong volume.
Targets:
Short-term: ₹2,150
Medium-term: ₹2,200
Stop-Loss: Place a stop-loss between ₹2,000 and 1970 to manage downside risk.

LUPINSymmetrical triangle pattern has given a very good breakout. Now an uptrend can be expected.
If it comes back below the resistance level the selling is expected to continue
If you find this helpful and want more FREE forecasts in TradingView, Hit the 'BOOST' button
Drop some feedback in the comments below! (e.g., What did you find most useful?
How can we improve?)
Your support is appreciated!
Now, it's your turn!
Be sure to leave a comment; let us know how you see this opportunity and forecast.
Have a successful week
DISCLAIMER: I am NOT a SEBI registered advisor or a financial adviser. All the views are for educational purpose only

Expecting a breakoutAs we can see from charts the stock tested multiple times support and trying for a breakout.
Also we got a flag pattern in daily time frame.
As Pharma sector looks bullish on coming days, lupin looks a good bet for me.

LUPIN | Buy @2000 | SL 1925 | 1st Target 2140, 2nd 2440Disclaimer:
This is not financial advice. Please do your own research or consult with a financial advisor before making any investment decisions. Investments in stocks can be risky and may result in loss of capital.

Review and plan for 25th February 2025 Nifty future and banknifty future analysis and intraday plan.
This video is for information/education purpose only. you are 100% responsible for any actions you take by reading/viewing this post.
please consult your financial advisor before taking any action.
----Vinaykumar hiremath, CMT

LUPIN | ADX rising | Short below 1890Disclaimer:
This is not financial advice. Please do your own research or consult with a financial advisor before making any investment decisions. Investments in stocks can be risky and may result in loss of capital.

ShortThis stock has been significantly overvalued for an extended period and seems to be due for a correction. Let’s take a closer look at what might unfold in the coming days:
If the stock breaks below the critical level of 1995, we could see a swift move down towards 1589. This level is an important support zone, but it doesn’t mean the downward move will stop there. Investors should be cautious, as there might be some relief around 1725, which could act as a temporary support point. However, this relief would likely be short-lived. Given the overall overvaluation and current market conditions, any bounce off 1725 would likely be weak and won't signal a sustainable recovery.
The key trigger for further downside would be a breach and close below 1995. Once this level is convincingly broken, the stock could face a significant downtrend. In such a case, investors should look to exit their positions, but with a well-placed stop-loss above 2175 to manage risk. That stop should offer protection in case of any unexpected rally or short-term bounce.
Looking further ahead, a deeper correction towards 1509 appears to be the more plausible scenario, considering the current overvaluation and market sentiment. This deeper pullback could be a key buying opportunity for those who are patient and have a longer-term perspective. Once the stock reaches these levels, it would present a more attractive risk-to-reward ratio for accumulation, as it could set the stage for a recovery that eventually takes the stock to new highs.

LongThe market has recently experienced a strong rally, successfully completing a W pattern, signaling a bullish reversal. However, given the recent momentum, it is likely that we could see some pullbacks in the near term as the market consolidates. Additionally, the Nifty has shown signs of weakness which could contribute to further corrections.
Once a stable bottom is established after this pullback, it would present an ideal opportunity to build long positions. With the broader bullish trend intact and the W pattern indicating a potential continuation, targeting 3800 could be a realistic goal for the next phase of the rally. This target aligns with the measured move from the W pattern, and if the market resumes its upward trajectory, reaching 3800 would seem plausible.

Lupin Cup breakoutLupin has broken out of a monthly cup pattern on the up side , with potential for upward movement using a small stoploss.
and yes, this is not a recommendation just for knowledge purpose


LUPIN | Flag Pattern Breakout AnalysisThe flag pattern breakout is a continuation chart pattern that often indicates the potential for strong directional movement.
Disclaimer :
This is not financial advice. Please do your own research or consult with a financial advisor before making any investment decisions. Investments in stocks can be risky and may result in loss of capital.

Lupin Weekend Trade, 11%+ Upside Potentialhi, back with another weekend trade, Sharing the trade idea of Lupin looks good recently did breakout easily give 11%+ within couple of week.

Lupin - A Value stock at Monthly breakoutLarge Cap
Double digit ROE, ROCE
PE ~= Industry PE
Piotroski = 8
PEG Ratio < 2
PE in Buy Zone
FII and DII presence
Technically,
Monthly: The price is retesting the monthly breakout.
Weekly: Flag and pole pattern
Daily and 4H Time frame: Price breaking the Trendline.
CCI (26) finally crossing above 100
**Not a buy/sell recommendation, only analysis.

Lupin Ltp technical Analysis with IndicatorsLupin Ltp technical Analysis with Indicators
Technical Indicators Overview
1. Moving Averages:
Trend: Medium- and long-term moving averages support a Buy signal, indicating that the stock is in a sustained bullish phase.
The price is likely trading above critical moving averages (e.g., 50-day and 200-day), adding further confirmation to the uptrend bias.
2. RSI (Relative Strength Index):
Current Status: RSI is in a neutral to slightly overbought zone.
Interpretation: This shows sustained bullish momentum without significant risk of immediate overbought conditions, aligning well with the potential for an upward breakout from the flag pattern.
3. MACD (Moving Average Convergence Divergence):
Current Status: The bullish crossover suggests positive momentum.
Interpretation: MACD supports the case for a continuation of the uptrend, complementing the flag pattern and moving averages.
Integrated Analysis
The flag pattern's breakout potential and indicators align well to suggest an upward continuation if key resistance levels are breached.
The moving averages and MACD provide medium- to long-term confirmation of bullish momentum.
The RSI ensures there's room for further upside without entering extreme overbought territory, reducing the risk of an immediate reversal.
Strategy Refinement
1. Bullish Trade Setup:
Entry: Above INR 2,150 (flag/channel breakout).
Indicators Confirmation:
Ensure the price holds above moving averages.
MACD should maintain a bullish crossover.
RSI stays below 70 after breakout.
Targets: INR 2,300 (short-term), INR 2,800–2,900 (flag breakout projection).
Stop Loss: Below INR 2,050.
2. Bearish Contingency Plan:
Entry: Below INR 2,000 if indicators turn bearish (e.g., RSI dips to 40–30 or MACD flips bearish).
Targets: INR 1,950, then INR 1,850 (channel breakdown targets).

Lupin Long-Term Investment IdeaAs we can see on the month chart stock breakout it rounding bottom after a many years with very good volume and retesting. Bullish crossover on November 2023
Technical Analysis & indicators 🔍
Monthly Chart
Rounding Bottom
Educational content 📖
This stock analysis is designed for educational purposes and should not be taken as financial advice. Please carry out your own research or consult with a financial advisor before investing.
Visit the website and check fundamental

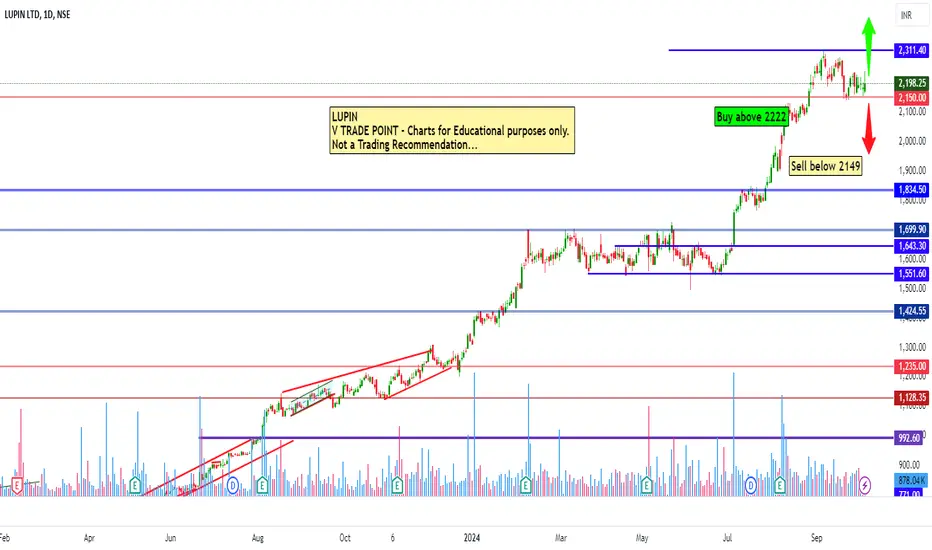
Lupin ltd view for Intraday 7th October #LUPIN Lupin ltd view for Intraday 7th October #LUPIN
Buying may witness above 2222
Support area 2180-2190. Below ignoring buying momentum for intraday
Selling may witness below 2149
Resistance area 2180
Above ignoring selling momentum for intraday
Charts for Educational purposes only.
Please follow strict stop loss and risk reward if you follow the level.
Thanks,
V Trade Point
Lupin Ltd view for Intraday 30th September #LUPIN Lupin Ltd view for Intraday 30th September #LUPIN
Buying may witness above 2235
Support area 2200. Below ignoring buying momentum for intraday
Selling may witness below 2199
Resistance area 2230
Above ignoring selling momentum for intraday
Charts for Educational purposes only.
Please follow strict stop loss and risk reward if you follow the level.
Thanks,
V Trade Point

Strategic Sell Setup for Lupin: Precision Trading with Defined RIn this Lupin sell trade setup , we are employing a systematic approach that ensures we trade based on a clear structure:
Identifying Key Levels:
The first step is to recognize a candle that has closed above the all-time high. This candle is crucial as it marks a potential exhaustion point or a possible reversal zone.
Confirmation with Consecutive Candles:
After spotting the all-time high candle, we need to confirm the market's bearish movement. The next two consecutive candles should close below each other, signaling that resistance is strong and the stock price is likely to move down.
Establishing Resistance:
The third key point is the confirmation of resistance. The downward pattern in candle closings suggests that selling pressure is increasing and resistance is solidifying. This signals a good opportunity to plan the trade.
Executing the Trade:
Finally, execute the sell trade based on the rules set in the strategy. This includes placing a stop-loss (27.65) and targeting a reward-to-risk ratio of at least 5:1. In this case, the target is 138.50 with an impressive reward-to-risk ratio of 5.01, ensuring the trade offers substantial profit potential compared to the risk.
This setup not only provides a clear structure for entry but also incorporates a solid risk management plan, making it a robust strategy for traders looking to capitalize on short opportunities in Lupin.

Lupin breakout in all time high.Lupin stock is break is all time high ragistance focus this stock and breakout the monthly candle .
Buy ......2230-2240
sl....2090
tgt......2750-2850
Follow only weekly

lupinpharmaceutical company
9 years breakout
2015 breakout
rounding bottom pattern breakout
bullish candle on monthly weekly and daily
25Q1 results beat all its life time
sales point of view
operational profits
PAT also beat all quter
EPS also give ever

lupin ATHLupin looks good on Daily , weekly and monthly chart
after 2 weeks of consolidation stock is on move again for highest closing in monlthly chart
watch this stock
www.tradingview.com

LUPINHi guys, In this chart i Found a Demand Zone in LUPIN CHART for Positional entry,
Observed these Levels based on price action and Demand & Supply.
*Don't Take any trades based on this Picture.
... because this chart is for educational purpose only not for Buy or Sell Recommendation..
Thank you
