Maruti - Is it Changing GearsMaruti - It has not remained for a long time below 60 RSI (Monthly) since 2014. Now again getting ready for a monthly RSI above 60!. I would rather wait for 400-500 Rs. more in Maruti and let it cross Monthly RSI above 60 and them jump in more confirmation.
DISCL - Not a SEBI Regitered. I post charts for my own study.
MARUTI trade ideas

1HR and 15MIN candle Narrow down Keep in Radarthe trading is narrowing down for past 4 days, keep in your radar,
Trading at SM20 closer and above, a good volume build in 15MIn candle at this area and added Triangle trendline structure
#note this is for my learning to evaluate myself, maybe keep this in your radar, am doing Paper trade only
7500CE


Maruti Suzuki looking BullishBreakout and Retest done on the weekly candle. Looking bullish . Levels marked on the chart. Cup n handle pattern and stoploss is on closing basis weekly

MARUTI - Breakout retest done - Investment/SwingPls refer the details given in previous ideas of MARUTI.
The link is given below.
Pls note that this is not a trade recommendation. Do your own study before entering into any trade.
Feel Free to comment for any suggestion or queries related to price action analysis

MARUTI SUZUKI INDIA LTD Daily Confluence of 2 Bearish bat strong zone
price need to follow GREEN TREND LINE if breaks , as there is COMPLEX M STRUCTURE IN RSI reading it may retest RSI 70
RED TREND LINE breaks invalidates trade
SELL

MARUTI 🚩 WHAT'S THE NEXT MOVE WOULD BE❓MARUTI🚩🍀
TWO POTENTIAL TRADES IN ONE CHART...
CMP 7559
VIEW 1 🚩
SELL AT CMP RANGE 7560 TO 7570
KEEPING SL AS 7665
(crutial point )on closing basis
TARGETS 🎯
7500/7470/7380/7298/7207
VIEW 2 🍀
If in cash BUY at
50% at 7290 to 7300 levels
&
50% at 7200 to 7210 levels
FOR F&O traders 7210 best buy zone
Keep 7100 as SL ON TWO CONSECUTIVE DAY CLOSING BASIS
TARGETS 🎯
7380/7470/7555/7660/7778++


Go short if open flat or almost flat and cross level Go short if open flat or almost flat and cross level

Maruti - Intraday Trade Setup Maruti CMP - 7709.25
Looking bearish in higher time frame. One can go for Intraday Trade setup with the following entry, exit & targets
Sell At or Below 7700 / Stop Loss 7723
Target 1 - 7682
Target 2 - 7662
Target 3 - 7642 / 7620
Disclaimer: This is my view and for educational purpose only.


MARUTI - NSE (Weekend Update)NSE:MARUTI
MARUTI - NSE
Technical analysis: Maruti Suzuki India Ltd (its creating 4th Wave)
I have also provided some support and resistance area in above chart.
Please follow the proper risk management before take any trade make your proper analye
If you like my Ideas please hit the 👍 LIKE button and share some of your ideas in comment section.

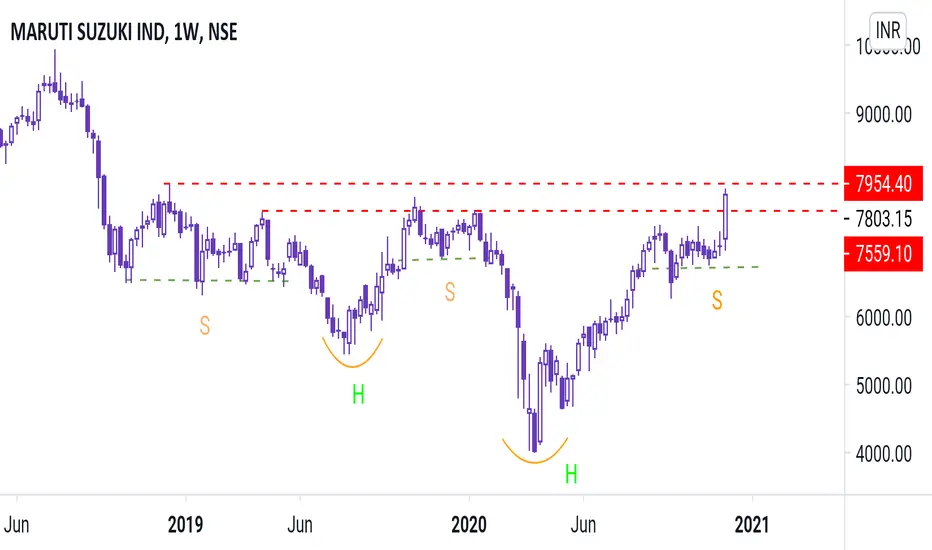
MARUTI - Bullish H&S Pattern Breakout - Swing/InvestmentThis analysis is in continuity of my previous analysis of the MARUTI. The link is attached here with for reference
Logic and trade strategy is explained in that idea.
Entry range and SL is shown in this image. Targets are similar to previous analysis.
This analysis is for study purpose. Traders must do their own study before entering into any trade. Traders should trade with their own risk capacity and money management.
Feel Free to comment for any query or suggestion regarding this stock or Price Action Analysis


Maruti While the break above 7080-7100 zone disappointing, it is on the back-drop certain euphoria. This is characteristic of market peak. Remain short for long term short stops 7300. A direct break below 7000 augurs well here. For the day 7200 should cap towards 70900 area.

MARUTI - In Reverse Gear..Interesting pattern in #MARUITI, If we assume that we are in 5th Wave and most likely it would turn out to be a truncated one (View negates if close above 7300). Within this we have rare a) Busted Inverse Head and shoulders. b) Forming minor Head and shoulders within c) Major H and S both forming their right shoulder. Volume is increasing. Need-less to say drive with rear view mirror. Just stay short below this level. Target first 6750 and once we break then 6400.

