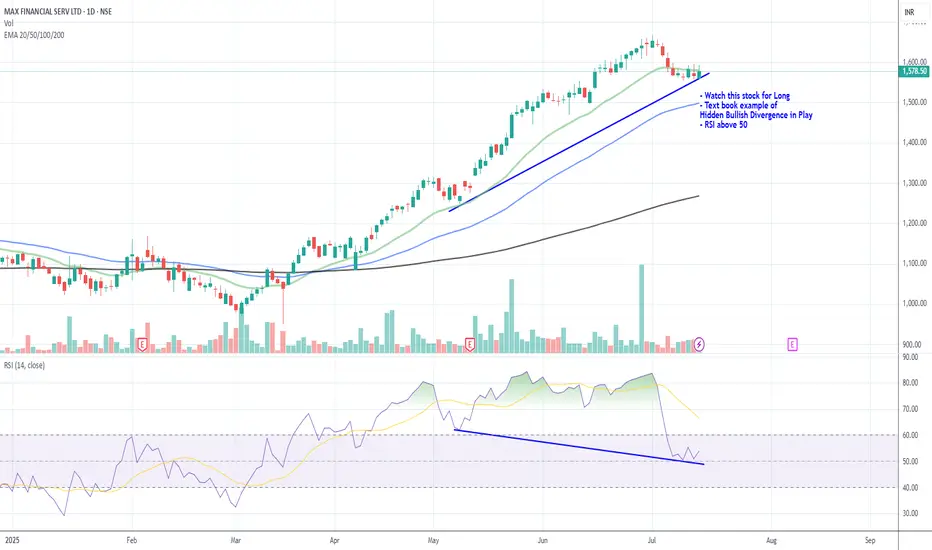
Watch MFSL for Long- Watch this stock for Long
- Text book example of
Hidden Bullish Divergence in Play
- RSI above 50
MFSL trade ideas
broking sector is bullish ?Broking sector is bullish as NSE listing is on news went thru some charts and mfsl gave me entry here definetly can go higher but I am happy wth 1:3

Cup and Handle break out in Max Financial ServicesIt seems like Max Financial Services Limited is breaking the resistance line of the cup and handle pattern, that it has been forming for the last 3 years. A breakout from the resistance trendline can drive the stock to 1700 and 2000 targets, as indicated by the pattern.

MFSL: Cup & HandleStock has given a breakout of Cup & Handle pattern and retested the neckline in Jan'25. The measured target for the same is coming in the region of 1900. On the downside the key level can be 1080.

Stock Analysis – Max Financial Services Ltd (MFSL)📅 Date: January 30, 2025
📊 Timeframe: Daily Chart
📌 Market Snapshot
🔹 Change: +34.15 points (+3.16%)
🔹 Volume: 331.73K (Below 20-day avg: 727.74K)(Keep a watch on volume)
🔹 Momentum Indicator: RSI breakout, EMA 200 Crossover
🔹 Strong Bullish Candle (Bullish Marubozu) forming
⚡ Levels to Watch
🔴 Key Resistance Zones (Above Current Price)
🚀 1,135.40 – Immediate hurdle
🚀 1,148.85 – Next breakout zone
🚀 1,177.75 – Major supply area
🟢 Key Support Zones (Below Current Price)
🔻 1,086.85 – Short-term support
🔻 1,057.95 – Key demand zone
🔻 1,041.40 – Strong base
🚀 Conclusion
MFSL is showing strong bullish momentum, backed by an RSI breakout and a 200 EMA crossover.
"Could the price sustaining above recent levels indicate further upward momentum, with a critical support zone in place?"
Multi Year Breakout on MFSLMFSL has given a multi year breakout after 3 plus years of consolidation.
Price has tested the level and we need to wait for the Weekly Candle close to be Bullish without any selling pressure to confirm this.
We can expect an upside target of 2000 level on this stock in the times ahead.
A buy on dips strategy can be applied for those looking to invest.

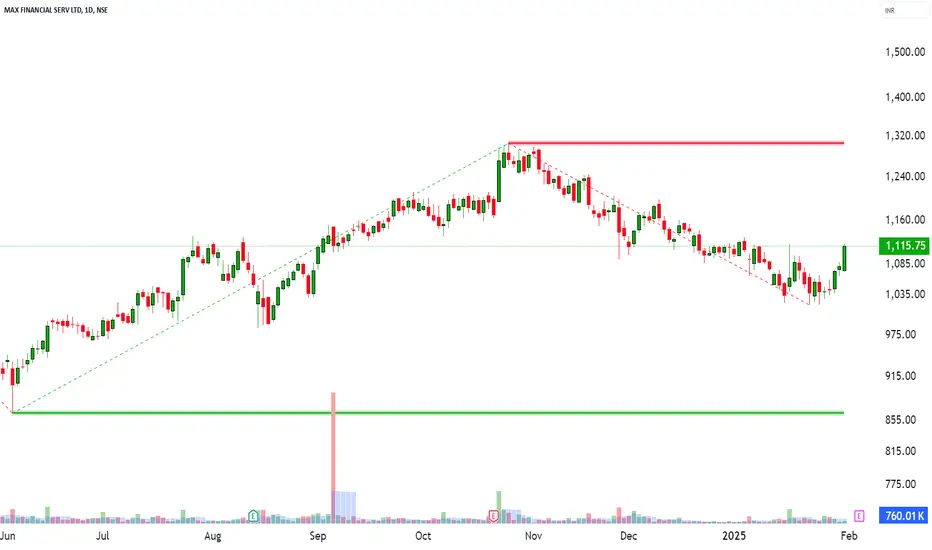
MAX FINANCIAL SERVICE S/R Support and Resistance Levels:
Support Levels: These are price points (green line/shade) where a downward trend may be halted due to a concentration of buying interest. Imagine them as a safety net where buyers step in, preventing further decline.
Resistance Levels: Conversely, resistance levels (red line/shade) are where upward trends might stall due to increased selling interest. They act like a ceiling where sellers come in to push prices down.
Breakouts:
Bullish Breakout: When the price moves above resistance, it often indicates strong buying interest and the potential for a continued uptrend. Traders may view this as a signal to buy or hold.
Bearish Breakout: When the price falls below support, it can signal strong selling interest and the potential for a continued downtrend. Traders might see this as a cue to sell or avoid buying.
20 EMA (Exponential Moving Average):
Above 20 EMA(50 EMA): If the stock price is above the 20 EMA, it suggests a potential uptrend or bullish momentum.
Below 20 EMA: If the stock price is below the 20 EMA, it indicates a potential downtrend or bearish momentum.
Trendline: A trendline is a straight line drawn on a chart to represent the general direction of a data point set.
Uptrend Line: Drawn by connecting the lows in an upward trend. Indicates that the price is moving higher over time. Acts as a support level, where prices tend to bounce upward.
Downtrend Line: Drawn by connecting the highs in a downward trend. Indicates that the price is moving lower over time. It acts as a resistance level, where prices tend to drop.
RSI: RSI readings greater than the 70 level are overbought territory, and RSI readings lower than the 30 level are considered oversold territory.
Combining RSI with Support and Resistance:
Support Level: This is a price level where a stock tends to find buying interest, preventing it from falling further. If RSI is showing an oversold condition (below 30) and the price is near or at a strong support level, it could be a good buy signal.
Resistance Level: This is a price level where a stock tends to find selling interest, preventing it from rising further. If RSI is showing an overbought condition (above 70) and the price is near or at a strong resistance level, it could be a signal to sell or short the asset.

SWING TUTORIAL - MFSLIn this tutorial, we analyze the stock NSE:MFSL (MAX FINANCIAL SERV LTD) identifying a lucrative swing trading opportunity following its all-time high in July 2021. The stock declined by nearly 50%, forming a Lower Low Price Action Pattern, but subsequently reversed its trend.
At the same time, we can also observe the MACD Level making a contradictory Pattern of Higher Highs. This Higher High Pattern of the MACD signaled the start of a Bullish Momentum, thereby also signaling a good Buying Opportunity.
The trading strategy yielded approximately 80% returns in 71 weeks. Technical analysis concepts used included price action analysis, MACD, momentum reversal, trend analysis and chart patterns. The MACD crossover served as the Entry Point, with the stock rising to its Swing High Levels of 1148 and serving as our Exit too.
As of wiring this tutorial, we can also notice how the stock is making a breakout and retest of the Swing High levels and trying to continue its momentum further upward trying to make a new All Time High.
KEY OBSERVATIONS:
1. Momentum Reversal: The stock's price action shifted from a bearish to a bullish trend, indicating a potential reversal.
2. MACD Indicator: The Moving Average Convergence Divergence (MACD) line showed steady upward momentum, signaling increasing bullish pressure.
3. MACD Crossover: The successful crossover in May 2023 confirmed the bullish trend, creating an entry opportunity.
TRADING STRATEGY AND RESULTS:
1. Entry Point: MACD crossover in May 2023.
2. Exit Point: Swing High Levels - 1148.
3. Return: Approximately 80%.
4. Trade Duration: 71 weeks.
NOTE: This case study demonstrates the effectiveness of combining technical indicators to identify bullish momentum. By recognizing Price Action, MACD movements, and Reversal patterns, traders can pinpoint potential entry and exit points.
Would you like to explore more technical analysis concepts or case studies? Share your feedback and suggestions in the comments section below.

Multiyear (3 Year) #BreakoutStock- Potential Upside 60-70%
- Monthly Breakout
- Volume Pop
- Recreating History
Like & Retweet to have your support🙌&❤️

Max Financial view for Intraday 24th September #MFSL Max Financial view for Intraday 24th September #MFSL
Buying may witness above 1205
Support area 1184-1185. Below ignoring buying momentum for intraday
Selling may witness below 1184
Resistance area 1200-1205
Above ignoring selling momentum for intraday
Charts for Educational purposes only.
Please follow strict stop loss and risk reward if you follow the level.
Thanks,
V Trade Point

MFSL cmp 1094.stock near all time high and crossing upper bollinger band with a long bullish candle. study chart and find your risk reward.

MFSL-- INVERTED HEAD & SHOULDER FORMATION MFSL-- Inverted head & shoulder on the daily chart. breakout has shown on the chart after the breakout price retraces to the neckline and forms a bullish engulfing.

will it fall from zone ? lets cexpecting a small fall in that zone .
- sell entry can be took at 0.58 fib level or look for selling confirmation inside the zone.
- sl is day close above 0.618 level
- expecting a small fall , so its suitable for intraday trade
- pattern becomes invalid if candle is closed above 0.618

MFSL Swing TradeMFSL Swing trading opportunity. Possible upside is expected up to the resistance level.

MFSLStock name - Max Financial Services Limited.
Daily chart setup
Heavy Volumes
7% to 12% Quick Move Possible
Master Score - B
Disclaimer: This is for demonstration and educational purpose only. this is not buying and selling recommendations. I am not SEBI registered. please consult your financial advisor before taking any trade.

#MFSL Max Financial Services Ltd. looks good for more upside. #MFSL
Max Financial Services Ltd. looks good for more upside.
Reclaimed a very important S/R zone (orange); Currently at Golden fib zone.
Also, Insurance sector overall seems to be gaining momentum.
Expecting an upside of about 20-30% in coming weeks/ months.

MFSL is up for a break out Wait for the breakout and target the fifth wave, with the sl below 4rth wave

MFSL UPTREND MAX FINANCIAL SERVICE LIMITED.. Wait for Confirmation candle . I Mentioned that Black line ,market above close green candle . Take entry ..


Parallel Channel pattern breakout in MFSLMAX FINANCIAL SERV
Key highlights: 💡⚡
✅On 1Hour Time Frame Stock Showing Breakout of Parallel Channel Pattern.
✅Strong Bullish Candlestick Form on this timeframe.
✅It can give movement up to the Breakout target of 950+.
✅Can Go Long in this stock by placing a stop loss below 890-.

MFSL_05FEB2024Strong reversal on cards, Base consolidation and maintaining strict stoploss can provide big chance of making green. Singapore government is watching closely. Their entry bounce and reversal and bounce back.

MFSL: Chart Looks PromisingTECHNICALS
1. Above 200 Moving Average
2. Long Trendline Break and sustain
3. Resistance Breakout and Retest
4. Hammer pattern at the retest
FUNDAMENTALS
1. Profits increasing every year
2. FIIs & DIIs Increased holdings June Quarter
3. Fundamental score of 8/9

Max Financial Services (MFSL)📈 Technical Analysis Overview:
MFSL witnessed its highest delivery % volume on 09-11-2023, indicating strong market interest. The chart also suggests a breakout based on pattern formation.
📊 Price Levels:
- *Buy Signal:* Initiate a long position on MFSL if it closes above ₹940.25.
- *Stoploss:* Set a stoploss at ₹918.10 (closing basis).
🎯 Profit Targets:
- *1st Target:* Consider booking profits in 50% of the quantity at ₹961.
- *2nd Target:* For the remaining quantity, aim for ₹993.60.
💡 Profit Management Strategy:
Always adapt to price action for profit-taking and safeguarding profits. Be vigilant and consider trailing profits based on market movements.
🚨 Disclaimer:
This analysis is for educational purposes only. I am not SEBI registered. The insights provided here are based on research and are strictly for knowledge and study purposes. Prior to making any trading decisions, seek advice from a certified financial advisor.
Happy Trading! 📊📈
