MGL trade ideas

MGL : LONG-INTRADAY {Support and Resistance} 17-05-2021MGL tried to break the support level but, failed.
We can expect a rapid up-move in MGL tomorrow.

MGL in consolidation phaseMgl is in consolidation phase. Expecting this phase to continue for short term. MGL will see a spike in price once work starts on natural gas availability in small cities.


Inverse H & S and if price close above 1209 then longInverse H & S and if price close above 1209 then long

MGL { 15 M short }Stock following a resistance trend line for reversal + IB in formation following a Doji
Short as it breaks, rest is as per charts
Note :-
Entry - At the break of mentioned candle's low/high
Stop Loss -
In a Short Trade, I always use Previous Candle High ( PCH ) as a stop loss while entering the trade. Sometime I might use 15 M tf SL & trade in 30M tf which I'll mention. Vice Versa for long trades
Trailing Stop Loss ( TSL ) - Mostly I trail stop loss by PCH as price falls . I exit as PCH breaks & vice versa
Use of PSAR as TSL :- TSL get's hit in trend following due to noise, In such cases I use PSAR to be in trend & exit if PSAR direction change
You can use any one of above mentioned or your own way to manage risk
Time Frame :- I take ~ 90% of my intraday trades in 15m tf. Where my analysis might come from higher frames like W , D or 1hr chart pattern which will be mentioned.
Target :- I do set target line based on support / resistance slightly above/ below it . Please pay attention to it

MGL { 15 M short }IB in formation at resistance in W frame . rest is as per charts
Note :-
Entry - At the break of mentioned candle's low/high
Stop Loss -
In a Short Trade, I always use Previous Candle High ( PCH ) as a stop loss while entering the trade. Sometime I might use 15 M tf SL & trade in 30M tf which I'll mention. Vice Versa for long trades
Trailing Stop Loss ( TSL ) - Mostly I trail stop loss by PCH as price falls . I exit as PCH breaks & vice versa
Use of PSAR as TSL :- TSL get's hit in trend following due to noise, In such cases I use PSAR to be in trend & exit if PSAR direction change
You can use any one of above mentioned or your own way to manage risk
Time Frame :- I take ~ 90% of my intraday trades in 15m tf. Where my analysis might come from higher frames like W , D or 1hr chart pattern which will be mentioned.
Target :- I do set target line based on support / resistance slightly above/ below it . Please pay attention to it


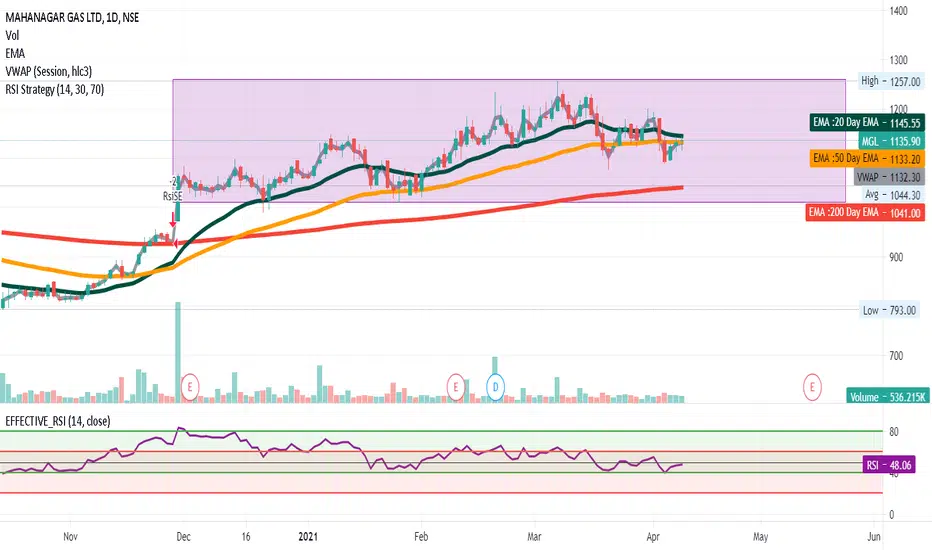
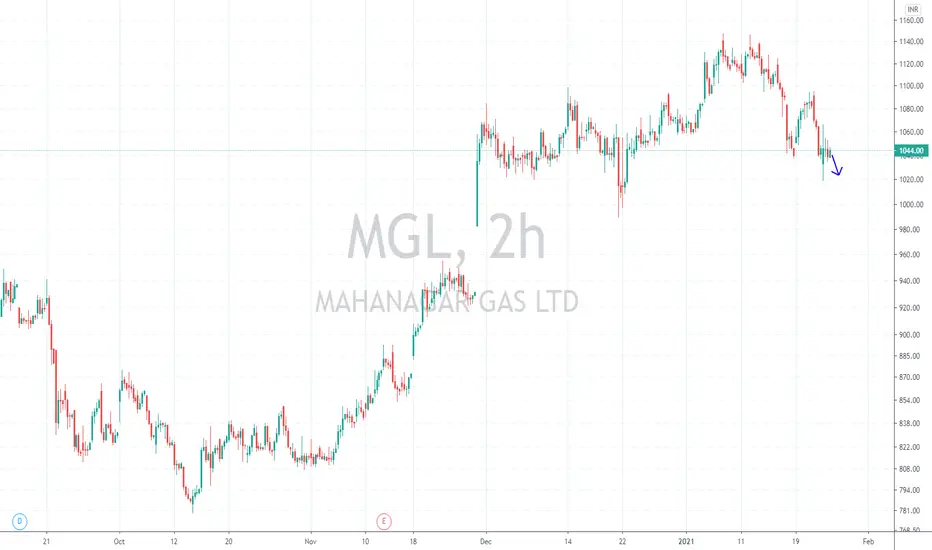
MGL - ShortMGL CMP - 1041.05
Looking bearish in higher time frame. One can go for Intraday / Swing Trade setup with the following entry, exit & targets
Sell at or Below 1040 ONLY / Stop Loss 1049
Target 1 - 1035
Target 2 - 1030
Target 3 - 1025
Disclaimer: This is my view and for educational purpose only.

MGL- CMP 1096MGL - CMP 1096. It is on break out. It has cleared many resistance points with huge cash volumes and rise in OI. It is on breakout with bowl formation. Can reach targets of 1190 and 1245, 1300. This is purely for educational purpose, any investment shall be done after consulting financial expert.


Breakout on daily chart.MGL has witnessed breakout at daily chart. Can go long with target of 1220 with the sl of 970. Entry level: 1070.

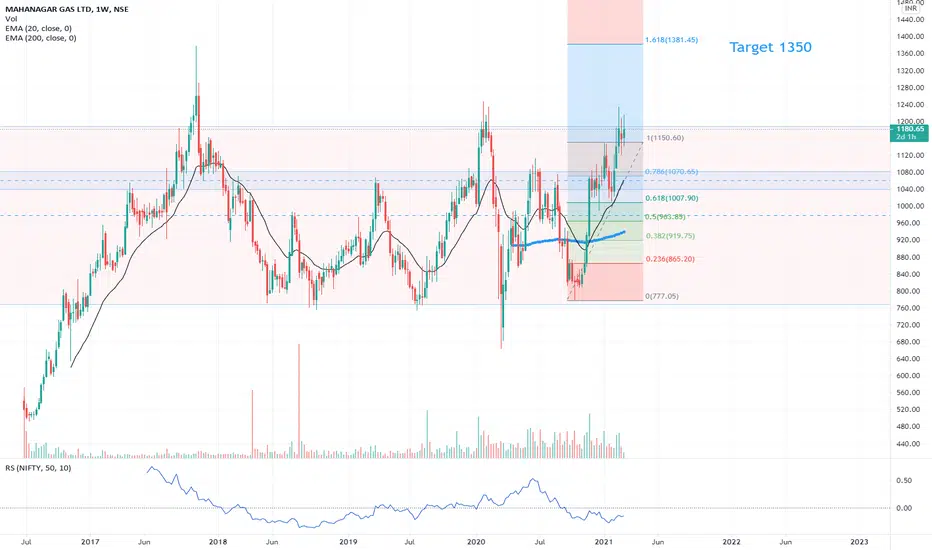
Mahanagar Gas Ltd (MGL) 60% ProfitDate: 19 Nov 2020
MGL (CMP: 921.30)
Type of Chart: Weekly Chart
Diamond pattern formation.
The weekly volumes are increasing on buy side. RSI is moving above 50 levels.
Breakout above 950 levels on weekly basis will confirm the pattern. If that happens then look for stock to move up towards 1525 levels.
Time frame: 102 weeks. i.e. target can be achieved by 14 Nov 2022.
If purchased at 950 then Profit = 60% over a period of 2 years. Very good returns for long terms bet.

MGL - The Cup is almost done...MGL - The Cup is almost done. wait for handle. from where ever it forms it can have a 160-200 pts upmove. What if the handle doesnot form at all and it moves up, then an aggressive trade bet may be taken for a SL of 880
DISC: Not a SEBI Registered. I post charts for my own study.


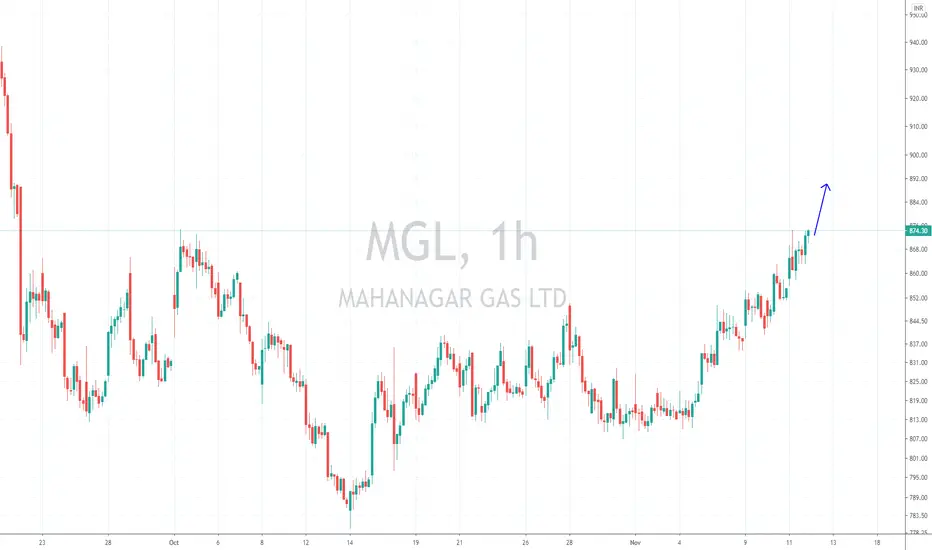
MGL - Intraday Trade SetupMGL CMP - 872.35
Looking bullish in higher time frame. One can go for Intraday trade setup with the following entry, exit & targets
Buy at or Above ONLY 878 / Stop Loss 869
Target 1 - 883
Target 2 - 886
Target 3 – 890 / 895
Disclaimer: This is my view and for educational purpose only.
MGL - Target Rs. 890 (Can it happen by December 2, 2020?) What is this idea for?
Target price for MGL Rs. 890 by December 2020
New Elliott Wave for MGL started around 13th October and now we are in Wave 3 with a modest target of Rs. 890 - aiming for this price around 1st week of December. I am happy with price movements and trend lines. NSE:MGL
Mahanagar Gas Ltd is in the business of City Gas Distribution (CGD), presently supplying Natural Gas in the city of Mumbai including its adjoining areas and the Raigad district, in the State of Maharashtra, India.

