MGL trade ideas


MGL Price Structure on Monthly Chart
MGL has reached at its Very Strong S&D area from where it has taken multiple times support.
If it survive and get demand then can head towards 100+ up-move.
If it doesn't survive(not get enough demand, and suppliers win) then we can see 100+ down-move too.
Down-move of stock is not expected (but in the market we never knows)
Oct & Nov month will play an important role for this stock. Because in past, it takes 1 month for testing area and stop its fall. In another 1 month, it starts bounce back to up-move.
In case it fails to get enough demands then stock will land in its worst price structure. In that case may be many investor start off-boarding. Stock may land into long consolidation too. That would be really very bad phase of this stock. But seeing its past behavior, this may not happen. :)
Let's keep close eye on its!
Note:
- Sharing for knowledge and information purpose only and not for trade.
NSE:MGL


MGL ( Is New Filling of Gas Started for New Journey ) Any of my investment or trades I share on my view are provided for educational purposes only and do not constitute specific financial, trading or investment advice. ... You must be aware of the risks and be willing to accept them in order to trade or invest in markets. Don't trade with money you can't afford to lose.


MGLMGL simple and clean chart, wait for price to come to support levels 770-757. buyers will step in this region and we can see a decent bounce from there towards 810/860/910

Weekly Chart Weekly time frame is very powerful ... let see if it support this ..... lets wait for Reversal Confirmation
Mgl can breakout to higher levelsMGL has made a good bullish move from the lower levels by forming an ascending triangle structure and can break the zone to higher levels. Volume is also increasing in the zone, leading to higher probability that it will move upwards.

MGL can breakout the triangle zone on higher levelsMGL has formed a bullish right angle triangle formation and can breakout on higher levels.

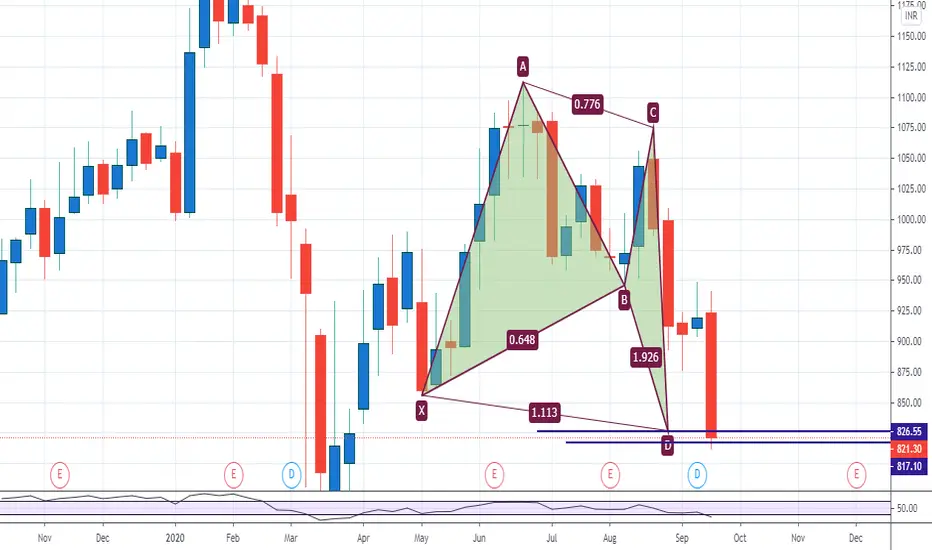
MGL stinks of Psychological overhangThe stock seems to having headache from the fact that it FAILED to pass the 1000 psychological level and the retracement on downtrend was just .232. Which makes a probable case for trend continuation and we target .5 fib extension.


Live Intraday Trading - Breakout trade in MGLA very good entry in MGL at breakout level which I have marked in the video . Though , I came out pretty quickly for some external reasons . Otherwise , it was a perfect breakout trade with a perfect entry point .


MGL breakout/supportMGL broke all support lines and is at last support line... i think it will break down and can fall down further


MGL
JUST CHECK THE PREVIOUS CHART SHARED, WHERE IT HIT OUR EXACT TARGET FROM THE SUPPORT
ALSO ONCE IT BROKE OUR SUPPORT, IT RETRACED 3% FROM THERE.
MGL NOW AGAIN CAN BE ENTERED WITH SUPPORT AT 960-963 WHERE IT CAN AGAIN REACH 974, 983, 990
IF BREAKS THIS SUPPORT, THEN CAN REACH 942
*********************************************************************************************************************************************
Hi all,
Its pleasure to have you all here.
I have started putting these charts as a contribution from my side to all people who are new to business, as I had to struggle a lot without any sources at disposal. So please consider this a just small contribution from my side.
Few Honest Disclosures:
1. Any idea shared is my personal view, its not a recommendation, neither any kind of paid propaganda, so please
do your bit of research.
2. Ideas shared does not mean that I trade all or have position in them, this is just a helping hand to all.
3. I expect no comments or like nor any negativity, as I said its just a small helping hand from my side, please plan your risk and trade as per your capacity.
4. To trade in Cash, options or futures is your sole choice and your own risk
5. I am no expert in Tech Indicators, I believe in support resistance and trendline theory, you may use this as a supplement theory for better results.
6. I work for my own living, this is a hobby which I do sincerely to help anyone who might come across my charts.
***********************************************************************************************************************************************


MGLNSE:MGL
It has been able to clear the marked area, from here it can be a buy above 1000 for target of 1016, 1024 and further it might go to 1038.
**********************************************************************************************************************************************
Hi all,
Its pleasure to have you all here.
I have started putting these charts as a contribution from my side to all people who are new to business, as I had to struggle a lot without any sources at disposal. So please consider this a just small contribution from my side.
Few Honest Disclosures:
1. Any idea shared is my personal view, its not a recommendation, neither any kind of paid propaganda, so please
do your bit of research.
2. Ideas shared does not mean that I trade all or have position in them, this is just a helping hand to all.
3. I expect no comments or like nor any negativity, as I said its just a small helping hand from my side, please plan your risk and trade as per your capacity.
4. To trade in Cash, options or futures is your sole choice and your own risk
5. I am no expert in Tech Indicators, I believe in support resistance and trendline theory, you may use this as a supplement theory for better results.
6. I work for my own living, this is a hobby which I do sincerely to help anyone who might come across my charts.
***********************************************************************************************************************************************
