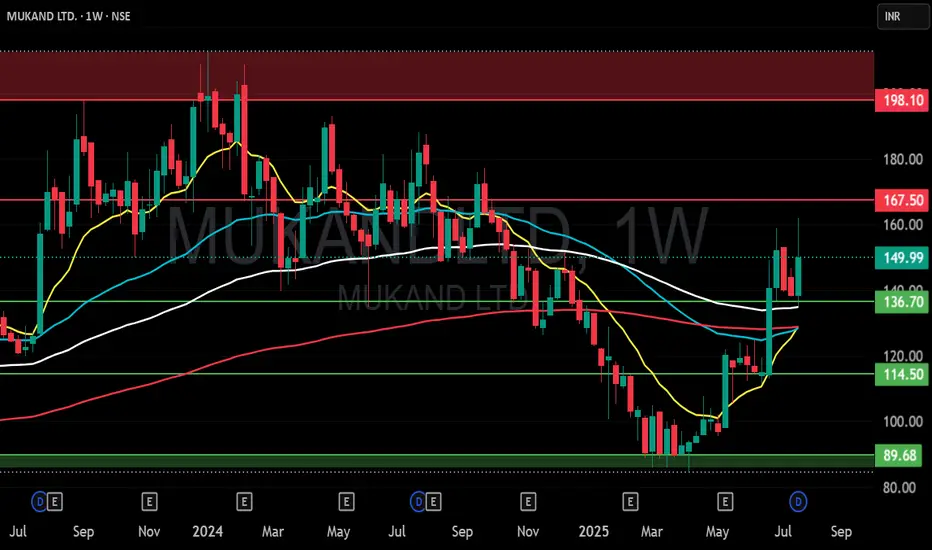
MUKAND LTD S/R Support and Resistance Levels:
Support Levels: These are price points (green line/shade) where a downward trend may be halted due to a concentration of buying interest. Imagine them as a safety net where buyers step in, preventing further decline.
Resistance Levels: Conversely, resistance levels (red line/shade) are where upward trends might stall due to increased selling interest. They act like a ceiling where sellers come in to push prices down.
Breakouts:
Bullish Breakout: When the price moves above resistance, it often indicates strong buying interest and the potential for a continued uptrend. Traders may view this as a signal to buy or hold.
Bearish Breakout: When the price falls below support, it can signal strong selling interest and the potential for a continued downtrend. Traders might see this as a cue to sell or avoid buying.
MA Ribbon (EMA 20, EMA 50, EMA 100, EMA 200) :
Above EMA: If the stock price is above the EMA, it suggests a potential uptrend or bullish momentum.
Below EMA: If the stock price is below the EMA, it indicates a potential downtrend or bearish momentum.
Trendline: A trendline is a straight line drawn on a chart to represent the general direction of a data point set.
Uptrend Line: Drawn by connecting the lows in an upward trend. Indicates that the price is moving higher over time. Acts as a support level, where prices tend to bounce upward.
Downtrend Line: Drawn by connecting the highs in a downward trend. Indicates that the price is moving lower over time. It acts as a resistance level, where prices tend to drop.
Disclaimer:
I am not a SEBI registered. The information provided here is for learning purposes only and should not be interpreted as financial advice. Consider the broader market context and consult with a qualified financial advisor before making investment decisions.
MUKANDLTD trade ideas
MUKANDLTDMUKAND Daily Chart | CMP ₹152.78
Massive breakout with volume. Price holding above previous resistance ₹150.5.
Structure bullish
TP1 near ₹176.
SL below ₹137.
Trend: Strong Bullish

MUKUND LIMITED - TECHNICAL VIEW - WEEKLY TIME FRAMEMukund Limited - technical view
MUKANDLTD, here we are in wave 4 complex correction & could end @ 91 levels. Lets see hoe wave 5 unfolds in MUKUNDLTD.

Mukand LimitedMukand Limited, Mukand consolidated net profit declines 21.36% in the June 2024 quarter
Net profit of Mukand declined 21.36% to Rs 24.33 crore in the quarter ended June 2024 as against Rs 30.94 crore during the previous quarter ended June 2023. Sales declined 8.99% to Rs 1257.99 crore in the quarter ended June 2024.


Long Opportunity in Mukand Ltd: Bullish Outlook for Potential UpMukand Ltd presents a compelling long opportunity as per my technical analysis. The stock has displayed strong bullish momentum, supported by robust fundamentals and positive market sentiment.
Technical indicators suggest that Mukand Ltd is poised for an upward trajectory, with the price currently trading above key moving averages and showing signs of continued bullish momentum. Additionally, the stock has reached a key price level and from here we may see an upward momentum.
With a clear bullish bias, I anticipate Mukand Ltd to continue its upward momentum in the coming trading sessions. However, as with any trade, it's essential to manage risk effectively and monitor price action closely for any signs of reversal.
Target - 210 and above, SL - 150
Disclaimer: This analysis is for educational purposes only and should not be construed as financial advice. Always conduct your research and consult with a certified financial advisor before making any investment decisions.

MUKANDLTDNSE:MUKANDLTD
One Can Enter Now !
Or Wait for Retest of the Trendline (BO) !
Or wait For better R:R ratio !
Note :
1.One Can Go long with a Strict SL below the Trendline or Swing Low.
2. R:R ratio should be 1 :2 minimum
3. Plan as per your RISK appetite and Money Management.
Disclaimer : You are responsible for your Profits and loss, Shared for Educational purpose

MUKANDLTD Looks bullish stock gave a good breakout of its all time high with good volumes and giving a healthy consolidation after the breakout.
before breakout also there was a long healthy consolidation for about 4 years.
currently on a weekly time frame there is good bullish candle which makes a strong closing on the upside.
if price sustains these levels new high can be seen in the stock soon.
keep this stock on your radar

MUKANDLTD strong breakoutprice broke multiyear resistance area
formed decent base above resistance and now broke that base
mcap 2373cr
stock pe 13.4 < industry pe 14.1
cmp 164 > book value 59.1
dividend yield 1.21%
debt to eq 1.74
promoter holding 74.7% vs 71.68% in MARCH 2017
recently company reduced debt significantly
balance sheet is getting improving
took very small position and will add/reduce accordingly
target not defined

Round Bottom Breakout - MUKANDPlease look into the chart for a detailed understanding.
Consider these for short-term & swing trades with 2% profit.
For BTST trades consider booking
target for 1% - 2%
For long-term trades look out for resistance drawn above closing.
Please consider these ideas for educational purpose

Triangle Pattern BreakoutPlease look into the chart for a detailed understanding.
Consider these for short-term & swing trades with 2% profit.
For BTST trades consider booking
target for 1% - 2%
For long-term trades look out for resistance drawn above closing.
Please consider these ideas for educational purpose
