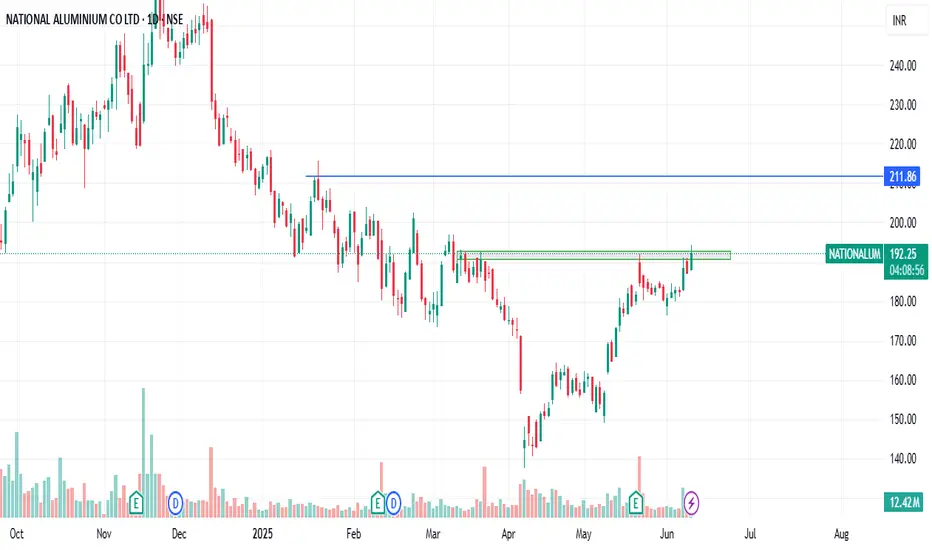
NATIONAL ALUMINUM - Bullish view VCP PatternLooking at minerals demand and geopolitical tensions- National aluminum is looking bullish technically too.
Making Volume Contraction Pattern, immediate resistance is 212.
Please do your own research before taking any trades
NATIONALUM trade ideas

National Aluminium bullish above 197National aluminum bullish above 197
stock will change its character from bearish to bullish once it crosses 197 level decisively
let's c how it reacts at that level

NALCO SellNALCO breaks below trend line within bigger channel setup. Already in downtrend. Sell @CMP (186) with SL of 192 and target of 180, 175 & 155. May also reach 120.

NALCO - Breakout and Retest complete. Where can it go?Results have been good too. Can it do 2X or 3X from here?

NATIONAL Aluminium is About to Give a BreakoutNATIONAL Aluminium is About to Give a Breakout on Daily Chart
Buy NALCO above 185 closing on daily frameThere is a breakout in National Aluminium corp. (NALCO) above 185 on daily frame.
From there, we can hit targets of 191,197, 203, 220 & 227.
stoploss against this investment can be placed around 175

National Aluminium 183 .. Breakout .. Good to have in PortfolioNational Aluminium 183 has given breakout. Support at 174. Target 207.
It is a good to have stock in portfolio
Currently trading at 6.4 PE and has potential to move to 13 PE which would be a price target of 372.
A good dividend payout company ( 4.5 %) and FII's have increased their stake.
With ROE @ 32.73 and ROCE @ 43.96 which are highest among the industry sector .

Nalco - Harmonic Pattern Analysis and outlookNATIONAL ALUMINIUM CO LTD: CMP- 183.84;
📉 Suggested Pattern:
- BAT harmonic pattern completion.
📊 Recent Price Action:
- Shares of National Aluminium Company Limited closed below the previous closing price.
- Formation of a Lower Low, reinforcing bearish sentiment.
📈 Forecast:
- Potential Downside Target: ₹166.
- Expected Consolidation Range if 166 is breached : ₹150-₹160.
🔍 Key Observations:
- The bearish trend suggests a continuation of the decline in the coming days.
- Important to monitor price action and volume dynamics for further confirmation

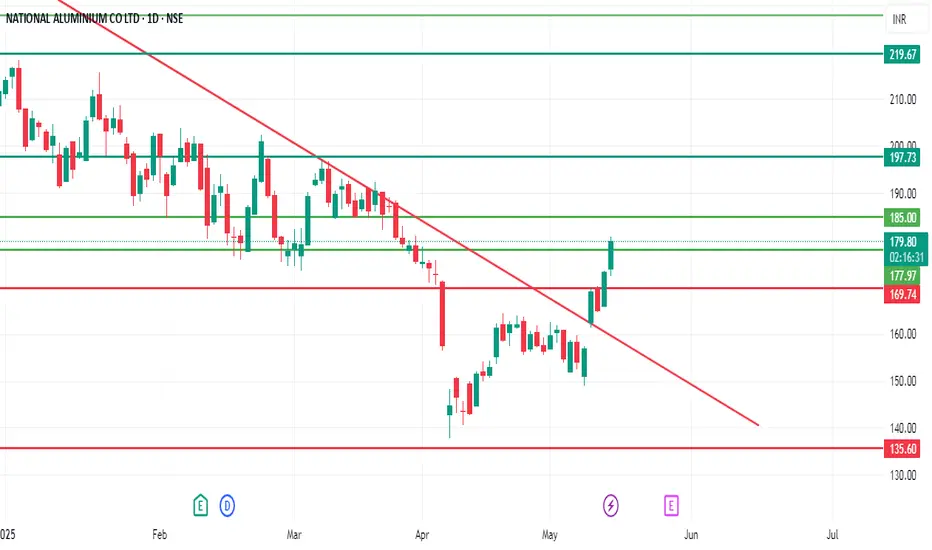
Go long in NALCOThere is a trendline breakout in National Aluminium. From here (CMP- 179.90) we can expect targets of 185, 197 & 220.
Stoploss against this investment can be placed near 165.
NATIONAL ALUMINIUM SWING TRADE📊 Price Action & Trend Analysis
Analyzing market trends using price action, key support/resistance levels, and candlestick patterns to identify high-probability trade setups.
Always follow the trend and manage risk wisely!
Price Action Analysis Interprets Market Movements Using Patterns And Trends On Price Charts.
👉👉👉Follow us for Live Market Views/Trades/Analysis/News Updates.

NALCONALCO
MTF Analysis
NALCOYearly Demand 136
NALCO 6 Month Demand 136
NALCOQtrly Demand BUFL 171
NALCOMonthly Demand 171
NALCOWeekly Demand 171
NALCODaily Demand DMIP 173
ENTRY -1 Long 173
SL 165
RISK 8
Target as per Entry 355
RR 23
Last High 263
Last Low 171

NATIONAL Aluminium: BullishThis is kind of trade, where you keep trailing. You do not limit the reward.
Just trail the SL until price closes below latest swing low.

National allmunium Upside PotentialNational allmunium more then 20% Upside Potential, add in your watchlist

Darvas Box Strategy - Break out Stock - Swing TradeDisclaimer: I am Not SEBI Registered adviser, please take advise from your financial adviser before investing in any stocks. Idea here shared is for education purpose only.
Stock has given break out. Buy above high. Keep this stock in watch list.
Buy above the High and do not forget to keep stop loss, best suitable for swing trading.
Target and Stop loss Shown on Chart. Risk to Reward Ratio/ Target Ratio 1:2
Stop loss can be Trail when it make new box / Swing.
Be Discipline, because discipline is the key to Success in Stock Market.
Trade what you See Not what you Think.

NATIONAL ALUMINIUM CO LTD S/RSupport and Resistance Levels:
Support Levels: These are price points (green line/shade) where a downward trend may be halted due to a concentration of buying interest. Imagine them as a safety net where buyers step in, preventing further decline.
Resistance Levels: Conversely, resistance levels (red line/shade) are where upward trends might stall due to increased selling interest. They act like a ceiling where sellers come in to push prices down.
Breakouts:
Bullish Breakout: When the price moves above resistance, it often indicates strong buying interest and the potential for a continued uptrend. Traders may view this as a signal to buy or hold.
Bearish Breakout: When the price falls below support, it can signal strong selling interest and the potential for a continued downtrend. Traders might see this as a cue to sell or avoid buying.
20 EMA (Exponential Moving Average):
Above 20 EMA(50 EMA): If the stock price is above the 20 EMA, it suggests a potential uptrend or bullish momentum.
Below 20 EMA: If the stock price is below the 20 EMA, it indicates a potential downtrend or bearish momentum.
Trendline: A trendline is a straight line drawn on a chart to represent the general direction of a data point set.
Uptrend Line: Drawn by connecting the lows in an upward trend. Indicates that the price is moving higher over time. Acts as a support level, where prices tend to bounce upward.
Downtrend Line: Drawn by connecting the highs in a downward trend. Indicates that the price is moving lower over time. It acts as a resistance level, where prices tend to drop.
RSI: RSI readings greater than the 70 level are overbought territory, and RSI readings lower than the 30 level are considered oversold territory.
Combining RSI with Support and Resistance:
Support Level: This is a price level where a stock tends to find buying interest, preventing it from falling further. If RSI is showing an oversold condition (below 30) and the price is near or at a strong support level, it could be a good buy signal.
Resistance Level: This is a price level where a stock tends to find selling interest, preventing it from rising further. If RSI is showing an overbought condition (above 70) and the price is near or at a strong resistance level, it could be a signal to sell or short the asset.
Disclaimer:
I am not a SEBI registered. The information provided here is for learning purposes only and should not be interpreted as financial advice. Consider the broader market context and consult with a qualified financial advisor before making investment decisions.

NATIONALUMNSE:NATIONALUM
One Can Enter Now !
Or Wait for Retest of the Trendline (BO) !
Or wait For better R:R ratio !
Note :
1.One Can Go long with a Strict SL below the Trendline or Swing Low.
2. R:R ratio should be 1 :2 minimum
3. Plan as per your RISK appetite and Money Management.
Disclaimer : You are responsible for your Profits and loss, Shared for Educational purpose

National Aluminium 4 Nov 2024Monthly BB Challenged
Weekly BB Challenged
Weekly Mother Candle
Daily Wait for Weekly MC to Break Out with good volume and BB Challenge
RSI is already above 60 in Daily

NALCO : H & S pattern update....Neck line being tested as of 31st Oct 24 on hourly chart.
For study purpose only...No financial advise

Head and shoulder in NALCOHead and Shoulder and resistance at key levels as well as test after H&S visible.

Darvas Box Strategy - Break out Stock - Swing TradeDisclaimer: I am Not SEBI Registered adviser, please take advise from your financial adviser before investing in any stocks. Idea here shared is for education purpose only.
Stock has given break out. Buy above high. Keep this stock in watch list.
Buy above the High and do not forget to keep stop loss, best suitable for swing trading.
Target and Stop loss Shown on Chart. Risk to Reward Ratio/ Target Ratio 1:2
Stop loss can be Trail when it make new box / Swing.
Be Discipline, because discipline is the key to Success in Stock Market.
Trade what you See Not what you Think.

National aluminium is ready to flythis stock taken support there is double confirmation gann fan and fib as well if it breaks previouse high it may not come to this support again ,this is for educational purpose onliy to learn how to analyse chart.

NATIONAL ALUMINIUM--buyAs expected share bottomed out and broke trendline now in 1st wave of 5th wave and in (3rd of 1st 5th wave .) build your position accordingly

NATIONALUM buy side "NATIONALUM bullish," it seems that the overall sentiment is positive, with many analysts and technical indicators suggesting a potential increase in the stock price
