NBCC BuyNBCC breaks below trend line after forming a triangle pattern at the top. Sell @CMP (117) with SL of 122 and target of 114, 100 & 90.
NBCC trade ideas

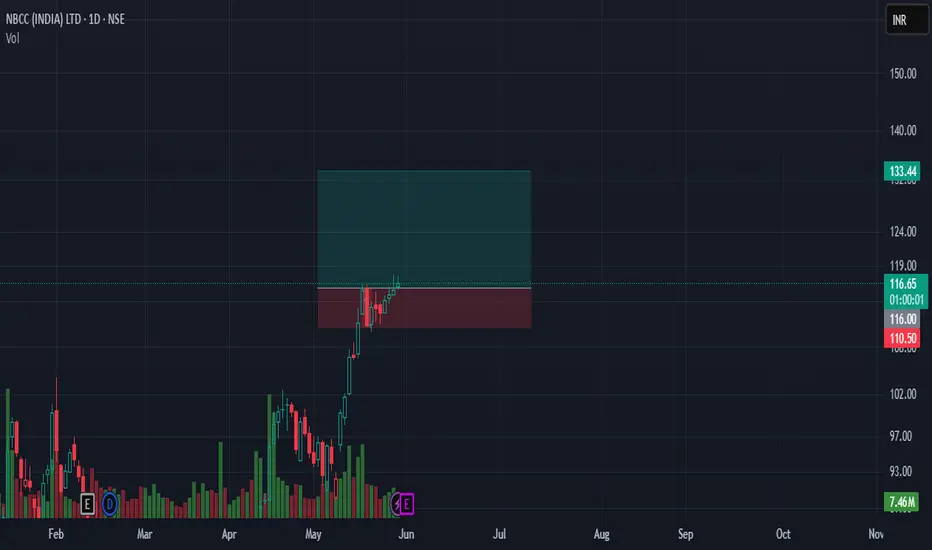
nbcc stockIn NBCC stock, a cup and handle pattern has formed on the 15-minute time frame and it is now retesting. One should watch this stock — a big move could come.

NBCC Short Term AnalysisThanks for stopping by.
The notes cover key details. I’ve backed every thesis with my own analysis — no fluff, just what matters to investors.
If you find the idea useful or have suggestions, feel free to leave a comment. Always open to fresh insights.
Kind regards,
Psycho Trader

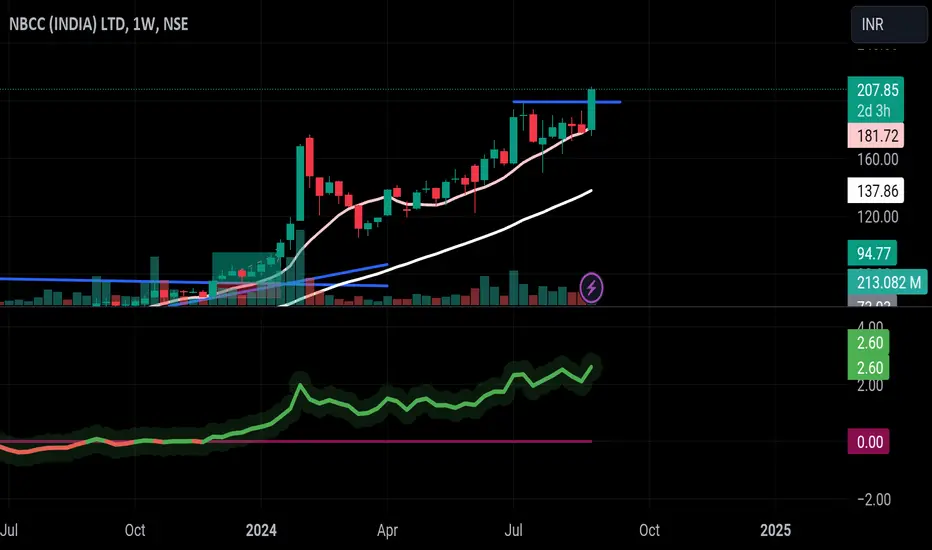
NBCC India Ltd.*NBCC India Ltd.*
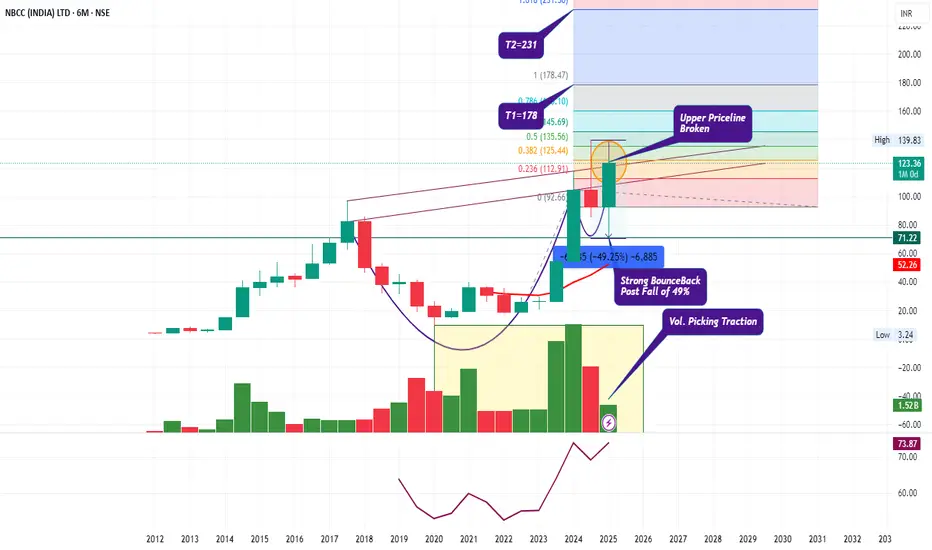
Rising C&H; formation on Yearly basis.
Strong Bounce back (Post fall of 49%) from Support Zone.
Volume Traction picking up.
RSI: 1H W>M. All in Bullish zone.
EMAs: Widening Gaps amongst 20/50/100/200 levels on Weekly Basis.
*Trail SL with Upside*
*Book Profit as per Risk Appetite*
Improving Financials. Rising Revenue on Qtrly /Yrly basis. Consistent Profitability Margins. Growing TNW, Acceptable WC Cycle. +ve CF from Ops. ~Consistent RoE / ROCE/ RoA
Promoter (Govt. Navratna Enterprise) Stake. Increasing FII Stake / Almost flat DII Stake.
Subcontracts work in back-to-back arrangement reducing WC requirement (pass on delays in realisations). Strong C&CE; of Rs.5.7K.
Concerns:
High Contingent liabilities.
*This is an Opinion. Do your own research as well.*
*_Happy Investing_*🤓
nbccnbcc is all good in charts and outperfomin in rs keep an eye on it close above 116 will make it go higher
Trendline Breakout and Cup & handle breakout Confirmation - NBCCTechnical Analysis:
Current Price: ₹111.08 (Note: As of the market close on Friday, May 16, 2025, NBCC closed around ₹110.85 on the NSE).
Target: Your target of ₹140 suggests a significant potential upside.
Trendline Breakout: Breaking above a significant downtrend line indicates a potential shift in momentum to the upside.
Cup & Handle Pattern Breakout Confirmation: The confirmation of a breakout from a Cup & Handle pattern is a strong bullish signal, suggesting a likely continuation of an upward trend.
Time Frame: A 1 to 3-month timeframe is reasonable for these patterns to play out, assuming the breakouts are sustained.
Confirming the Breakouts:
Volume: It's crucial to have seen a noticeable increase in trading volume during both the trendline and the Cup & Handle breakouts. Strong volume adds significant validity to these signals.
Sustainability: The price should hold above the breakout levels in the coming trading sessions.
Potential Upside:
Target (₹140): Represents a potential upside of approximately 26% from the ₹111.08 level (or around 26.3% from the ₹110.85 closing price).
Quarterly and Yearly Results & EPS Comparison:
Based on the information available up to the latest reported quarter (December 2024) and the previous fiscal year (FY24):
Latest Quarter Result (December 2024): NBCC reported a consolidated net profit of ₹113.45 Crore, a significant increase of 60.81% compared to the same quarter last year (December 2023). Total income also increased by 17.25% to ₹2456.54 Crore.
Yearly Result (FY2024): For the full fiscal year ending March 2024, NBCC's total revenue stood at ₹7835.59 Crore, a growth of 10.75% compared to FY23. The profit after tax for FY24 was ₹277.66 Crore, a growth of 10.54% YoY.
EPS Comparison:
Quarterly EPS (December 2024): ₹0.63, compared to ₹0.39 in December 2023.
Yearly EPS (FY2024): ₹1.54, compared to ₹1.39 in FY23.
We will need the results for the quarter ending March 2025 (Q4FY25) and the full fiscal year ending March 2025 (FY25) for the most up-to-date comparison. These are expected in the coming weeks.
P/E Comparison:
Based on the closing price of ₹110.85 and the FY24 EPS of ₹1.54, the current P/E ratio is approximately 71.98.
According to some sources, as of May 17, 2025, the P/E ratio is around 59.8. The construction and infrastructure sector can have a wide range of P/E ratios depending on growth prospects and company specifics. While seemingly high, it could be justified if the market anticipates strong future earnings growth, as suggested by the recent quarterly results. We'll get a clearer picture with the FY25 EPS.
Corporate Action:
Dividend: For FY24, NBCC declared a final dividend of ₹0.14 per share. Investors will be looking for any dividend announcement that typically accompanies the full-year results for FY25.
Order Book: NBCC has been consistently securing new orders, which is a positive sign for future revenue and profitability. Keep an eye on any new order wins announcements.
Latest News (as of May 17, 2025):
Recent news around NBCC has been generally positive, focusing on:
Strong Q3FY25 Results (Dec 2024): The significant jump in profit was a key highlight, boosting investor confidence.
Order Wins: NBCC continues to secure new projects across various sectors, including infrastructure and real estate. These new orders provide revenue visibility for the coming quarters.
Focus on Execution: The market is often looking at NBCC's ability to efficiently execute its large order book. Any positive updates on project progress are usually well-received.
Government Initiatives: Being a government-owned entity, NBCC's performance is also linked to government spending on infrastructure and housing. Positive policy announcements in these areas can be beneficial.
Key Factors to Monitor:
Breakout Sustainability: Ensure the price holds above the breakout levels with sustained volume.
Upcoming Q4 & FY25 Results: These will be crucial in determining if the recent profit growth trend continues and will impact the P/E valuation. Look for the announcement dates.
New Order Wins: Any further significant order wins will act as positive catalysts.
Execution Progress: Updates on the progress of major projects in their order book will be important.
Market Sentiment: Overall market sentiment and the performance of the infrastructure and construction sectors will play a role.

NBCC- FOR SWING TRADEFrom 9th May after taking support from 50 EMA price is bullish and today it has given a breakout of its very important Resistance level which was 105.
Next target can be 112.50 to 119.

NBCC (India) Ltd (NSE: NBCC) – Breakout Trade Setup🧾 Equity Research Summary – NBCC (India) Ltd.
Sector: Construction & Infrastructure – Government PSU
Technical Setup: Trendline breakout + Base retest + Volume surge
Support Zone: ₹68–₹75
Breakout Zone: ₹100–₹103
Upside Potential: Strong move expected due to order book + infra push
Catalyst:
Government infrastructure spending
Order wins from CPWD, NBCC contracts, redevelopment projects
📅 Timeframe: Short-to-Medium Term (2–4 weeks)
📊 Risk-Reward: 1:2.5
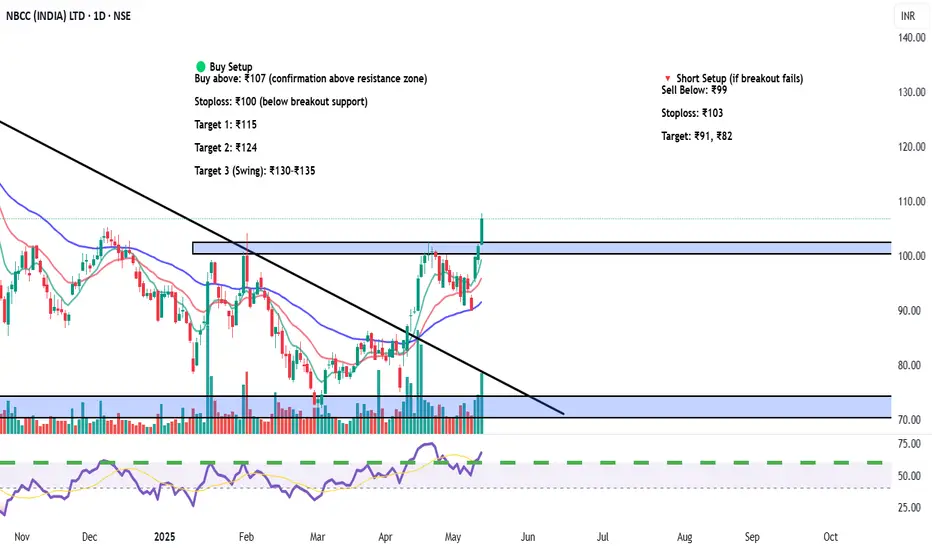
🟢 Buy Setup
Buy above: ₹107 (confirmation above resistance zone)
Stoploss: ₹100 (below breakout support)
Target 1: ₹115
Target 2: ₹124
Target 3 (Swing): ₹130–₹135
🔻 Short Setup (if breakout fails)
Sell Below: ₹99
Stoploss: ₹103
Target: ₹91, ₹82
For Education Purposes Only
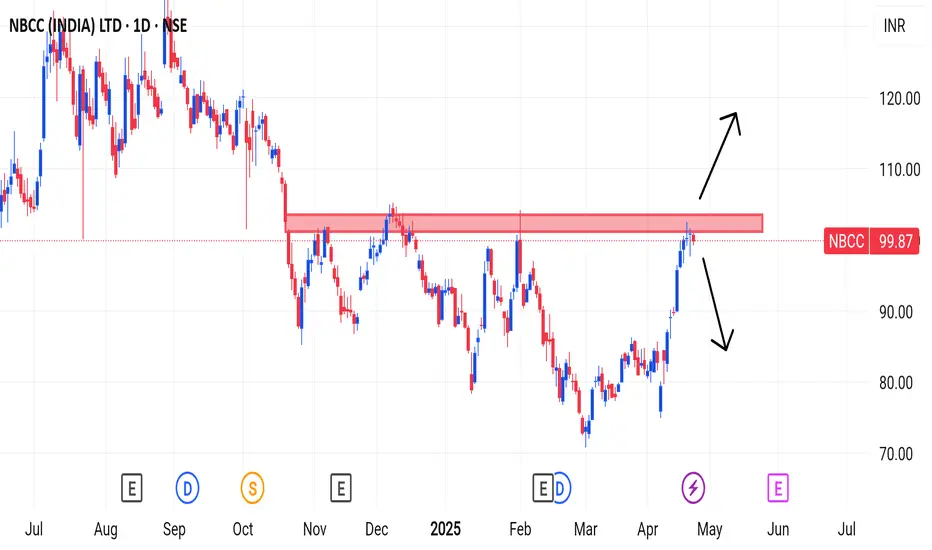
NBCCAn uptrend can be expected above the resistance level.
If it comes back below the resistance level the selling is expected to continue
If you find this helpful and want more FREE forecasts in TradingView, Hit the 'BOOST' button
Drop some feedback in the comments below! (e.g., What did you find most useful?
How can we improve?)
Your support is appreciated!
Now, it's your turn!
Be sure to leave a comment; let us know how you see this opportunity and forecast.
Have a successful week
DISCLAIMER: I am NOT a SEBI registered advisor or a financial adviser. All the views are for educational purpose only
NBCC: Poised for a Potential Comeback?
🛡️ Price: Around **85.85 INR** (currently) – Consider scaling in if it reaches the **"Retracement Zone for Wave B" of 82.26 INR.**
🎯 Target: **107-110 INR** (Target at Wave C)
🛑 Stop-Loss: **Daily close below 79.4 INR**
🤔 Why this trade?
✅ Approaching retracement zone – potential strong support.
✅ Potential for a good Risk/Reward.
✅ Wave pattern suggests an upcoming upswing.
💡 Pro Tip: The chart shows a clear downtrend followed by a retracement. If the price consolidates within the retracement zone and shows **bullish divergence** on indicators like **RSI** or **MACD**, it could signal a potential reversal. **Watch for a break above the short-term downtrend line** for additional confirmation before entering.
⚠️ Risk/Reward Calculation (Example - You MUST calculate your own based on YOUR entry):
Let's assume entry at **82.26 INR** (bottom of the retracement zone) and the defined stop-loss of **79.4 INR**:
🔹 **Potential Gain (using midpoint of target zone):** 108.5 - 82.26 = **26.24 INR**
🔹 **Potential Loss:** 82.26 - 79.4 = **2.86 INR**
🔹 **Risk/Reward Ratio:** **26.24 / 2.86 = Approximately 9.17:1**
🙏 Important:
🚨 This is just an idea, **not financial advice.**
⚠ **Trading has risks – you could lose money.**
🧐 **Do your own research before making any trades.**
#Nifty #StockMarket #Trading #TechnicalAnalysis #DayTrading #SwingTrading #Investment #MarketAnalysis #StocksToWatch #BullishSetup #Nifty #BankNifty #GIFTNIFTY

Analysis of NBCC (India) Limited ChartOverview:
The daily price chart of NBCC (India) Limited indicates a recovery phase after a significant correction from its 2024 highs. Key support and resistance levels are identified, along with a potential pattern that suggests consolidation followed by a breakout.
Key Observations:
1.Trend Analysis:
The stock was previously trading within an ascending channel, marked by higher highs and higher lows, indicating a bullish trend until August 2024.
Post-August, the stock broke below the channel, resulting in a sharp correction of approximately -30%.
2.Support Levels:
₹84.25: Strong support zone, as highlighted by multiple touches and a bounce from this level. It acted as a demand zone during the correction.
The stock formed a short-term base in the ₹84–₹90 range, leading to the current recovery.
3.Resistance Levels:
₹102.10: Immediate resistance, corresponding to the 100-day moving average (acting as a dynamic resistance).
₹111.44: The next major resistance from previous highs and the upper boundary of the consolidation zone.
4.Potential Pattern Formation:
A possible W-shaped reversal pattern is forming. If the stock sustains above ₹93.09 (mid-level support) and breaks ₹102.10, the next target could be ₹111.44.
The pattern suggests a consolidation phase before a potential breakout above ₹111.44.
5.Volume and RSI Analysis:
Volume: Increased buying interest near the ₹84 zone, indicating accumulation.
RSI: Currently recovering from oversold levels, indicating improving bullish momentum.
6.News Catalysts:
The Housing and Urban Development tie-up to develop a land parcel in Noida could provide a fundamental boost, aiding positive price action.
Projection and Strategy:
Bullish Scenario: Sustained breakout above ₹102.10 may lead to ₹111.44 and beyond. Traders could consider this level as a pivot point for long positions.
Bearish Scenario: Failure to hold ₹93.09 may lead to a retest of ₹84.25, where buyers could step in again.
Conclusion:
The stock is in a recovery phase, supported by strong fundamentals and technical patterns. Traders and investors should monitor key levels like ₹93.09 (support) and ₹102.10 (resistance) for confirmation of further trends.

NBCC recover from 0.786 level with double bottomHello Fellow Traders,
NBCC price was at the edge of level 1 and the price broke the level 0.786 of Fibonacci trend retracement and forms the double bottom pattern as double confirmation for entry long.
Consider 0.786 as the stop loss if the price fails to go as predicted and enjoy the profit if the price further breaks the 0.5 level.
Happy Trading!!!

nbccNBCC (India)
NBCC
entered into a memorandum of understanding with state-owned Mahanager Telephone Nigam
MTNL
for a project valued at 16 billion Indian rupees

Technical Analysis of NBCC India LtdTechnical Analysis of NBCC India Ltd
Overview of the Stock - The chart shows a 1-hour timeframe of NBCC India Ltd, a public sector undertaking in India. The analysis is based on technical indicators and price action.
Key Observations
Downward Trend: The overall trend appears to be downward , as evidenced by the descending trendline connecting the highs.
Support Levels: The price has been finding support around the 182-184 level. A break below this level could signal further downside.
Resistance Levels: The 200-day moving average (DMA) has acted as a resistance level in the past. A break above this level could indicate a potential reversal.
Fibonacci Retracement: The price has retraced to the 0.5 Fibonacci level (around 179.91) after a previous decline. This level might provide support.
Volume: There is no significant volume data shown in the chart. However, a surge in volume could accompany a breakout or breakdown.
Potential Scenarios
Continuation of Downward Trend: If the price breaks below the 182-184 support level, it could continue its downward trend. The next support levels to watch are the 0.5 Fibonacci level and the 150-day moving average.
Reversal: A break above the 200-day moving average could signal a potential reversal. However, this would require strong volume and confirmation from other technical indicators.
Range-Bound Trading: If the price remains between the 182-184 support and the 200-day moving average resistance, it could indicate a period of range-bound trading.
Conclusion - Based on the chart, NBCC India Ltd appears to be in a downward trend. However, there is potential for a reversal if the price breaks above the 200-day moving average. It is important to monitor support and resistance levels, as well as volume, to make informed trading decisions.
Disclaimer: This analysis is based on the provided chart and is for educational purposes only. It does not constitute financial advice. Always consult with a financial advisor before making investment decisions. Do your own research because I am not SEBI registered person and this is my personal opinion about the stock only for educational purposes.
Thanks for your support as always.

Symmetrical triangle Good volume build in daily time frame.
Highest volume buildup in day.
Symmetrical triangle breakout with good volume.
Fundamental's are Good.
NOTE: I do my analysis, do yours before trade.

Nbcc (india) Limited Nbcc (india) Limited TP hit prices can rally if key resistance broken impulsively, move your stops or book some partials.

NBCCBreakout happend in this stock with rising 200dma and RS indicator is also showing strength.
Keep your risk and reward ratios according to your own preferance.
This is for educational purpose, do your own research before investing
NBCC potential breakout - Long base VCP setup
- Trading in a narrow range
- Volume contraction
- Low risk entry point

NBCC chart analysisNBCC chart analysis on daily time frame.
1. Trendline breakout.
2. Looks good above 187
3. Support near 170.

50 SMA Rising - Swing TradeI am not a Sebi registered adviser.
This Idea is publish purely for educational purpose only before investing in any stocks please take advise from your financial adviser.
50 SMA Rising strategy. Suitable for Swing Trading Initial Stop loss lowest of last 2 candles and keep trailing with 50 days SMA if price close below 50 SMA then Exit or be in the trade for 2 to 4 weeks.
Do not Forget to Exit is Stop loss Hit.
Be Discipline because discipline is the Key to Success in the STOCK Market.

Next Big move on NBCC India Ltd..Next Big move on NBCC India Ltd
For Longs as price is at the resistance turn support, Wait for the trend line brake with volume. take a lower time frame long entry to increase risk to reward ratio..

Long Scalp:Long Scalp: custom made indicator for Long and Short Scalp: In this case giving solid Long signal. Solid means multiple indication about trend and momentum. The two important features needed for scalp.

NBCC - AnalysisBullish Levels -day closing above 178 (early entry) then 225 to 232 (safe entry if day closing above this) then 315 then 405 then 495 then 578 to 592 if sustain above this then Long term tragest can be 1027 to 1041 then 1332 to 1339 or 1477 to 1491
Bearish levels :- Day closing below 172 (SL for Swing trade) then 142 then 126 (SL for Long term Investor) below this more bearish.
**Consider some Points buffer in above levels
**Please do your due diligence before trading or investment.
**Disclaimer -
I am not a SEBI registered analyst or advisor. I does not represent or endorse the accuracy or reliability of any information, conversation, or content. Stock trading is inherently risky and the users agree to assume complete and full responsibility for the outcomes of all trading decisions that they make, including but not limited to loss of capital. None of these communications should be construed as an offer to buy or sell securities, nor advice to do so. The users understands and acknowledges that there is a very high risk involved in trading securities. By using this information, the user agrees that use of this information is entirely at their own risk.
Thank you.
