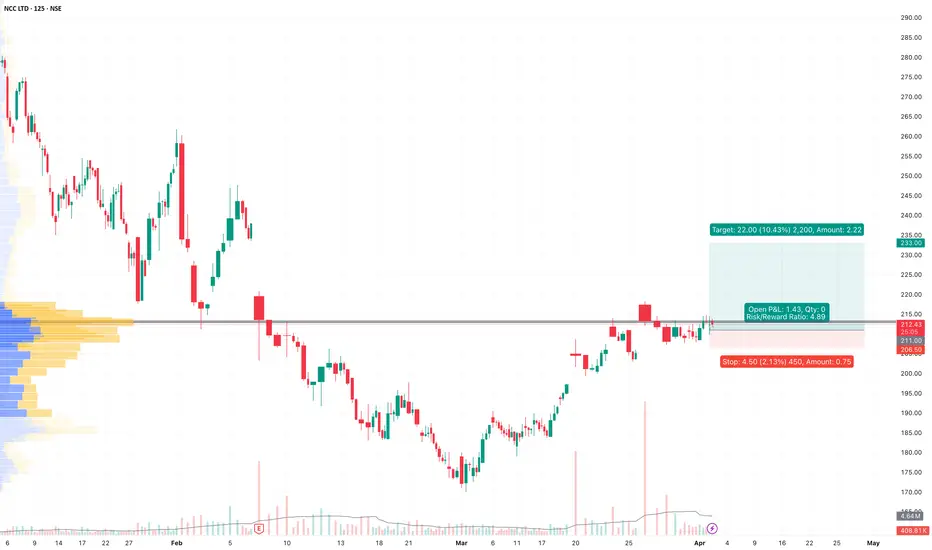
NCC - NCC LTD (2 hours chart, NSE) - Long PositionNCC - NCC LTD (2 hours chart, NSE) - Long Position; short-term research idea.
Risk assessment: High {volume & support structure integrity risk}
Risk/Reward ratio ~ 4.9
Current Market Price (CMP) ~ 212.70
Entry limit range ~ 212.50 to 209.50 (Avg. - 211) on April 02, 2025 at 12:53 PM.
1. Tar
Next report date
—
Report period
—
EPS estimate
—
Revenue estimate
—
13.06 INR
8.20 B INR
221.99 B INR
410.59 M
About NCC LTD
Sector
Industry
CEO
Ananta V. R. R. Alluri
Website
Headquarters
Hyderabad
Founded
1978
ISIN
INE868B01028
FIGI
BBG000CWV634
NCC Ltd. engages in the provision of construction and engineering services. It operates through India and Outside India segments. The firm focuses on buildings and housing, water and environment, irrigation, electrical, roads, metals, power, railways, and mining. The company was founded by Alluri Venkata Satyanarayana Raju in 1978 and is headquartered in Hyderabad, India.
Related stocks
NCCNCC
MTF Analysis
NCCYearly Demand 183.0
NCC 6 Month Demand BUFL 183.0
NCC Qtrly Demand 183.0
NCCMonthly Demand 183.0
NCCWeekly Demand SOE 198.0
NCC Daily DMIP 198.0
ENTRY -1 Long 198.0
SL 170.0
RISK 28.0
Target as per Entry 560.0
RR 12.9
Last High 365.0
Last Low 17

NCC Ltd – Short-Term Technical Analysis (15-min chart)📊 NCC Ltd – Short-Term Technical Analysis
Chart Pattern: Wolfe Wave (Bearish Setup)
Chart time frame - 15-min chart
Current Price: ₹211.40
Critical Breakdown Level: ₹206.50
Target Price Zone: ₹198
Bias: Bearish short-term
🧠 Pattern Analysis: Wolfe Wave
Wolfe Wave (points 1–5) structure is clear

NCC- A good Bargain here?!1. Trendline & Support Levels:
A long-term upward trendline (dashed pink line) is drawn connecting significant lows.
The price recently tested the trendline support and rebounded slightly, indicating a possible buying interest at this level.
Historical bounces from this trendline (circled in purple)

NCC LTD S/R Support and Resistance Levels:
Support Levels: These are price points (green line/shade) where a downward trend may be halted due to a concentration of buying interest. Imagine them as a safety net where buyers step in, preventing further decline.
Resistance Levels: Conversely, resistance levels (re

NCC : Building reversal chart🚀 Poised for a breakout or breakdown? Explore the latest on NCC LTD! 📈📉
### Chart Analysis
Wave Analysis : Chart indicates Elliott Wave pattern with waves 1 through 5.
Current Position : Price currently in Wave 4 completion zone (281-312) .
Deep Retracement Zone : Around 276-286 levels .


NCC wont stop from here if runs ahead!
- The price has broken out from a consolidation phase and formed a bullish candle, indicating a strong upward momentum.
- The stock price has achieved a gain of approximately 9.23%, closing at 337.75.
- The breakout level was around 297.85, which now acts as a support level.
- The next resistanc


See all ideas
Summarizing what the indicators are suggesting.
Neutral
SellBuy
Strong sellStrong buy
Strong sellSellNeutralBuyStrong buy
Neutral
SellBuy
Strong sellStrong buy
Strong sellSellNeutralBuyStrong buy
Neutral
SellBuy
Strong sellStrong buy
Strong sellSellNeutralBuyStrong buy
An aggregate view of professional's ratings.
Neutral
SellBuy
Strong sellStrong buy
Strong sellSellNeutralBuyStrong buy
Neutral
SellBuy
Strong sellStrong buy
Strong sellSellNeutralBuyStrong buy
Neutral
SellBuy
Strong sellStrong buy
Strong sellSellNeutralBuyStrong buy
Displays a symbol's price movements over previous years to identify recurring trends.
Frequently Asked Questions
The current price of NCC is 217.71 INR — it has decreased by −0.08% in the past 24 hours. Watch NCC LTD stock price performance more closely on the chart.
Depending on the exchange, the stock ticker may vary. For instance, on NSE exchange NCC LTD stocks are traded under the ticker NCC.
NCC stock has fallen by −2.08% compared to the previous week, the month change is a −3.11% fall, over the last year NCC LTD has showed a −35.78% decrease.
We've gathered analysts' opinions on NCC LTD future price: according to them, NCC price has a max estimate of 315.00 INR and a min estimate of 223.00 INR. Watch NCC chart and read a more detailed NCC LTD stock forecast: see what analysts think of NCC LTD and suggest that you do with its stocks.
NCC stock is 2.68% volatile and has beta coefficient of 1.53. Track NCC LTD stock price on the chart and check out the list of the most volatile stocks — is NCC LTD there?
Today NCC LTD has the market capitalization of 139.73 B, it has increased by 2.44% over the last week.
Yes, you can track NCC LTD financials in yearly and quarterly reports right on TradingView.
NCC LTD is going to release the next earnings report on Aug 5, 2025. Keep track of upcoming events with our Earnings Calendar.
NCC LTD revenue for the last quarter amounts to 53.76 B INR, despite the estimated figure of 53.40 B INR. In the next quarter, revenue is expected to reach 51.87 B INR.
NCC net income for the last quarter is 2.54 B INR, while the quarter before that showed 1.93 B INR of net income which accounts for 31.39% change. Track more NCC LTD financial stats to get the full picture.
Yes, NCC dividends are paid annually. The last dividend per share was 2.20 INR. As of today, Dividend Yield (TTM)% is 0.99%. Tracking NCC LTD dividends might help you take more informed decisions.
EBITDA measures a company's operating performance, its growth signifies an improvement in the efficiency of a company. NCC LTD EBITDA is 19.18 B INR, and current EBITDA margin is 8.64%. See more stats in NCC LTD financial statements.
Like other stocks, NCC shares are traded on stock exchanges, e.g. Nasdaq, Nyse, Euronext, and the easiest way to buy them is through an online stock broker. To do this, you need to open an account and follow a broker's procedures, then start trading. You can trade NCC LTD stock right from TradingView charts — choose your broker and connect to your account.
Investing in stocks requires a comprehensive research: you should carefully study all the available data, e.g. company's financials, related news, and its technical analysis. So NCC LTD technincal analysis shows the strong sell today, and its 1 week rating is sell. Since market conditions are prone to changes, it's worth looking a bit further into the future — according to the 1 month rating NCC LTD stock shows the buy signal. See more of NCC LTD technicals for a more comprehensive analysis.
If you're still not sure, try looking for inspiration in our curated watchlists.
If you're still not sure, try looking for inspiration in our curated watchlists.