NCC - NCC LTD (2 hours chart, NSE) - Long PositionNCC - NCC LTD (2 hours chart, NSE) - Long Position; short-term research idea.
Risk assessment: High {volume & support structure integrity risk}
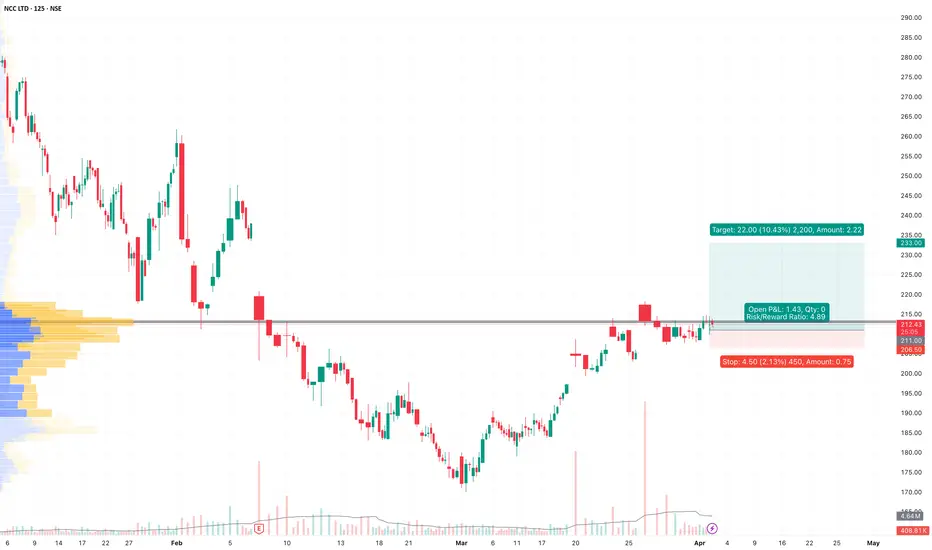
Risk/Reward ratio ~ 4.9
Current Market Price (CMP) ~ 212.70
Entry limit range ~ 212.50 to 209.50 (Avg. - 211) on April 02, 2025 at 12:53 PM.
1. Target limit ~ 223 (+5.69%; +12 points)
2. Target limit ~ 233 (+10.43%; +22 points)
Stop order limit ~ 206.5 (-2.13%; -4.5 points)
Disclaimer: Investments in securities markets are subject to market risks. All information presented in this group is strictly for reference and personal study purposes only and is not a recommendation and/or a solicitation to act upon under any interpretation of the letter.
LEGEND:
{curly brackets} = observation notes
= important updates
(parentheses) = information details
~ tilde/approximation = variable value
-hyphen = fixed value
NCC trade ideas
NCCNCC
MTF Analysis
NCCYearly Demand 183.0
NCC 6 Month Demand BUFL 183.0
NCC Qtrly Demand 183.0
NCCMonthly Demand 183.0
NCCWeekly Demand SOE 198.0
NCC Daily DMIP 198.0
ENTRY -1 Long 198.0
SL 170.0
RISK 28.0
Target as per Entry 560.0
RR 12.9
Last High 365.0
Last Low 170.0

NCC Ltd – Short-Term Technical Analysis (15-min chart)📊 NCC Ltd – Short-Term Technical Analysis
Chart Pattern: Wolfe Wave (Bearish Setup)
Chart time frame - 15-min chart
Current Price: ₹211.40
Critical Breakdown Level: ₹206.50
Target Price Zone: ₹198
Bias: Bearish short-term
🧠 Pattern Analysis: Wolfe Wave
Wolfe Wave (points 1–5) structure is clearly formed, indicating a potential trend reversal.
The break below the line connecting points 1–4 (support trendline) would confirm the pattern breakdown.
The expected move is toward the line connecting points 1–4 and extending through 5, which typically acts as the target line — marked near ₹198.
📉 Supporting Bearish Factors:
📉 Volume Divergence: Visible decline in volume while price moved higher from point 4 to point 5, indicating weak bullish momentum.
📊 Histogram Momentum AO Indicator: Clear bearish divergence visible; momentum weakening as price rises.
⬇️ Breakdown expected below ₹206.50 – this will likely trigger the bearish move toward ₹198.
🛑 Short-Term Trading View:
⚠️ Watch for a close below ₹206.50 – potential short swing.
🏁 Expecting to reach: ₹198 zone
📍 Above ₹213 or point 5’s high direction may change
⚠️ Disclaimer:
This analysis is intended for educational purposes only and does not constitute investment advice. Stock trading involves high risk, and past patterns or performance do not guarantee future results. Please consult your financial advisor before making any trading decisions.

NCC- A good Bargain here?!1. Trendline & Support Levels:
A long-term upward trendline (dashed pink line) is drawn connecting significant lows.
The price recently tested the trendline support and rebounded slightly, indicating a possible buying interest at this level.
Historical bounces from this trendline (circled in purple) suggest it has been a strong support in the past.
2. RSI (Relative Strength Index) Analysis:
The RSI is currently at 27.05, which is in the oversold zone (<30).
Historically, when RSI reached similar levels, the stock rebounded.
The RSI-based moving average is 40.92, significantly above the RSI, suggesting potential weakness.
3. Price Action & Reversal Signs:
A sharp decline was observed, followed by a slight recovery, hinting at demand near the support zone.
The candlestick pattern near the trendline could indicate potential reversal or temporary consolidation.
4. Key Levels to Watch:
Resistance: Around 280-300 INR, where the stock previously faced selling pressure.
Support: Near 118-120 INR, which is a long-term horizontal support (dotted black line).
Conclusion:
The stock is at a crucial support zone and could bounce if buyers step in.
The oversold RSI suggests that selling pressure may be exhausted.
If it breaks below the trendline, it may test the 118 INR level.
If it holds and moves up, the next target could be 200-220 INR in the short term.

NCC LTD S/R Support and Resistance Levels:
Support Levels: These are price points (green line/shade) where a downward trend may be halted due to a concentration of buying interest. Imagine them as a safety net where buyers step in, preventing further decline.
Resistance Levels: Conversely, resistance levels (red line/shade) are where upward trends might stall due to increased selling interest. They act like a ceiling where sellers come in to push prices down.
Breakouts:
Bullish Breakout: When the price moves above resistance, it often indicates strong buying interest and the potential for a continued uptrend. Traders may view this as a signal to buy or hold.
Bearish Breakout: When the price falls below support, it can signal strong selling interest and the potential for a continued downtrend. Traders might see this as a cue to sell or avoid buying.
20 EMA (Exponential Moving Average):
Above 20 EMA(50 EMA): If the stock price is above the 20 EMA, it suggests a potential uptrend or bullish momentum.
Below 20 EMA: If the stock price is below the 20 EMA, it indicates a potential downtrend or bearish momentum.
Trendline: A trendline is a straight line drawn on a chart to represent the general direction of a data point set.
Uptrend Line: Drawn by connecting the lows in an upward trend. Indicates that the price is moving higher over time. Acts as a support level, where prices tend to bounce upward.
Downtrend Line: Drawn by connecting the highs in a downward trend. Indicates that the price is moving lower over time. It acts as a resistance level, where prices tend to drop.
Disclaimer:
I am not a SEBI registered. The information provided here is for learning purposes only and should not be interpreted as financial advice. Consider the broader market context and consult with a qualified financial advisor before making investment decisions.

NCC : Building reversal chart🚀 Poised for a breakout or breakdown? Explore the latest on NCC LTD! 📈📉
### Chart Analysis
Wave Analysis : Chart indicates Elliott Wave pattern with waves 1 through 5.
Current Position : Price currently in Wave 4 completion zone (281-312) .
Deep Retracement Zone : Around 276-286 levels .
Profit Booking Zones :
First target at 335-342 .
Second target at 376-390 .
Stop Loss : 270.55 on failing Wave 4 consolidation.
### Trade Plan
Entry : Consider entering around the Wave 4 completion zone (281-312) .
Target :
First target at 335-342 .
Second target at 376-390 .
Stop Loss : Place a stop loss at 270.55 to manage risk.
### Conclusion
Potential for significant movement from the current zone .
Monitor closely and adjust the plan as needed.
Offers a strong risk-reward setup .
📢 Disclaimer : This trade plan is for informational purposes only and does not constitute financial advice. Always conduct your own research and consult with a qualified financial advisor before making any investment decisions.
#NCCLTD #TechnicalAnalysis #TradingPlan #StockMarket #Investment #ElliottWave


NCC wont stop from here if runs ahead!
- The price has broken out from a consolidation phase and formed a bullish candle, indicating a strong upward momentum.
- The stock price has achieved a gain of approximately 9.23%, closing at 337.75.
- The breakout level was around 297.85, which now acts as a support level.
- The next resistance level to watch is around 463.80.
- Volume has increased significantly, supporting the bullish breakout.
This suggests that NCC Ltd has the potential to continue its upward trajectory, targeting the next resistance level around 463.80.
Would you like to analyze another stock or need more detailed analysis on this one?


NCC LTD ---- GIVES BRAKEOUT ON DAILY CHARTNSE:NCC
NCC Ltd Gives Brake out on Daily chart,
Buy Near 320
Sl 295
Target 380+
Time duration 15-20 days
Risk Reward Ratio - 1 : 2.50
Profit on capital Ratio 18%

NCC SHORT TERM AND LONG TERM VIEW Clear breaout on daily time frame with good volume.
Fundamentally strong made a video also
Check aaa easy trading and investing with man thapa

Head & Sholuder break out with good volumeHead & Sholuder break out with good volume
Keep in radar, target is same as length of head of the pattern

NCC Breakout ?Volumes are high
Can be a Breakout at ATH.
Disclaimer : This is not a Buy or Sell recommendation. Please consult your financial advisor before making any investments . This is for Educational purpose only.


buy the stock gave a good breakout on daily charts with huge volumes. there is clear breakout of resistance of cup . target 310 . SL close below 267 which would indicate fake breakout.


NCC long idea LONG TERM PICK , can buy around 148/149 sl 134
solid order book , hopefully company walks the talk

NCC LTDNCC has breakout ATH level and create good opportinuty for positional trade
and this is just for Educational purpose only

NCC - A Multibagger in making in front of our eyes?NCC - CMP 225
Stock is approaching towards 16 Years old Resistance Zone 225-235. Stock is making A big rounding bottom & attempting a breakout of big resistance zone. As per my view, If stock breaks 235 & Sustain above that for few weeks then it will become a multibagger in coming years.
If Stock sustain above 225-235 Zone
Support 200
Resistance 300-365-425
Note : View is personal. DYOR & Trade/Invest.

Delivery Buy NCC cmp 163.5 . 22% Upside PotentialDelivery Buy cmp 163.5
Target 172,188,200
22% Upside Potential
High Financial Strength,
Technically Bullish. Potential breakout

NCC has given a strong breakout on daily time frame chart NCC has given a strong breakout on daily time frame chart with huge volume spike
Company has delivered good profit growth of 23.8% CAGR over last 5 years
Debt to Equity - 0.23

Uptrend A nice follower of 50 SMA
Shared possible set ups .
Gratify if you appreciate the practice then you can like it, share it and
If you want me to investigate any chart for you then would cherish doing that for you.
Thank you for your time and support.
Stay safe.
