NDTV # Chance to Grap 30%NDTV is Showing potential reversal from current levels till 30% upside. Risky Trade considering the fundamentals .
NDTV trade ideas

SWING IDEA - NDTVThe Stock seems to be following the Trendline and successfully forming Higher High and Higher Low Pattern.
Convergence Divergence is also in play currently.
MACD Crossover has also happened exactly at Trendline retouch indicating a move upward.
Election results has helped the stock to rally as well, since Modi government retains power for the 3rd time.
If everything goes well, stock should be ready for its next leg up and possibly start making new Higher Highs too.

New Delhi Television LtdTARGET IN CHART
SL - 200
FUNDAMENTALS
Market Cap
₹ 1,727 Cr.
Current Price
₹ 268
High / Low
₹ 359 / 167
Stock P/E
Book Value
₹ 42.9
Dividend Yield
0.00 %
ROCE
18.6 %
ROE
15.7 %
Face Value
₹ 4.00
Promoter holding
69.7 %
EPS last year
₹ 7.56
EPS latest quarter
₹ 0.92
Debt
₹ 6.23 Cr.
Pledged percentage
0.00 %
Net CF
₹ 7.37 Cr.
Price to Cash Flow
-133
Free Cash Flow
₹ -23.9 Cr.
Debt to equity
0.02
OPM last year
15.0 %
OPM 5Year
17.1 %
Reserves
₹ 251 Cr.
Price to book value
6.28
Int Coverage
2.66
PEG Ratio
Price to Sales
5.11
Sales growth 3Years
1.12 %
Profit Var 3Yrs
24.4 %

ndtv indiasecured its board's approval to restart the regular operations of its channel, NDTV Profit, on Dec. 8, according to a Tuesday filing.
The company halted the operations of the channel in June 2017.

NDTV - Ichimoku BreakoutStock Name - New Delhi Television Limited
Ichimoku Cloud Setup :
1). Today's close is above the Conversion Line
2). Future Kumo is Turning Bullish
3). Chikou span is slanting upwards
All these parameters are showing bullishness at Current Market Price
and more bullishness AFTER crossing 268
#This is not Buy and Sell recommendation to any one. This is for education purpose and a helping hand to learn trading in Market.
#CloudTrading
#IchimokuCloud
#IchimokuFollowers
#Ichimokuexpert
I hope you all like my analysis.
Please do share your thoughts into comment section.
Please give a like, share & subscribe for daily analysis.

NDYV likely ready for a break to 225-35-55Anticipating an extended bullish flag with on going consolidation. Supported with continuous drise in delivery rate. This may give 10-15% returns in a 2 month time frame.
Being a adani group company it has high beta and may show high volatility. It not a recommendation to buy it's a narrative representation of chart pattern .

NDTV - DAILY TIME FRAMEThe Structure looks good to us, waiting for this instrument to correct and then give us these opportunities as shown on this instrument (Price Chart).
Note: Its my view only and its for educational purpose only. Only who has got knowledge about this strategy, will understand what to be done on this setup. its purely based on my technical analysis only (strategies). we don't focus on the short term moves, we look for only for Bullish or Bearish Impulsive moves on the setups after a good price action is formed as per the strategy. we never get into corrective moves. because it will test our patience and also it will be a bullish or a bearish trap. and try trade the big moves.
we do not get into bullish or bearish traps. We anticipate and get into only big bullish or bearish moves (Impulsive Moves). Just ride the Bullish or Bearish Impulsive Move. Learn & Know the Complete Market Cycle.
Buy Low and Sell High Concept. Buy at Cheaper Price and Sell at Expensive Price.
Keep it simple, keep it Unique.
please keep your comments useful & respectful.
Thanks for your support....
Tradelikemee Academy

NDTV Looks in Wave 4...upside looks promising Please go through the chart of NDTV where in we can see the structure that is looking like an impulse. In minor wave it is in 4th wave 5th wave may go up to 273.
Note it.
This is not a trade reco.
Regards.

NDTV perfect move so farIn my previous idea i showed the NDTV is good to short.. now trade is going very well
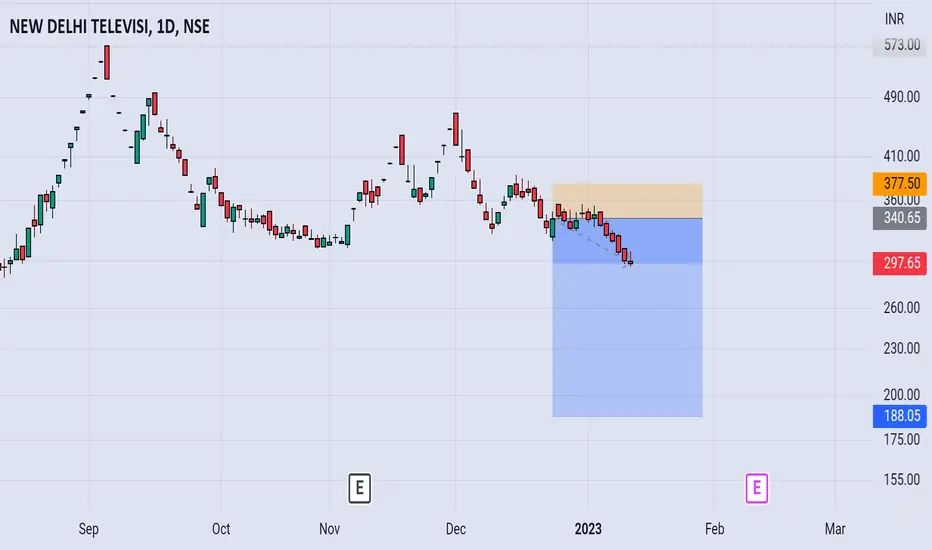
Time to short NDTVNDTV looks Very bearish in higher 1D timeframe.
4H is also very bearish. short and wait..
Recommended 💪

-80% to -100% possibility short opportunity 5th wave complete73,50,19,10,5 and ZERO is the possibility after this double top!!
Elliott's bullish 5th wave is complete and the least target is 229(50% down) with this bearish divergence
channel viewers are about to go to zero as board members and journalists left

NDTV seems good for investmentNDTV Seems ready for bigger up move, stock has consolidated long and now breakout resistance trend line with huge volumes.
Can long above 280, add more if it comes to 260, 240, 220, 200.
SL 160 Closing basis.
Targets 300, 350, 400, 450, 500+
Good fundamentals, debt free, good promoters and FIIs holding.
Pl like and follow.
Saptarish Trading

NDTV NSE BULLISHVIEW ABOVE 277 CMP 298NDTV NSE is bullish if 277 holds. NEW 52WEEK High. Fresh Breakout. Positive Trend.
Disclaimer: Educational Purpose Only. Not Buy Sell Reco . Not Sebi Registered.


