Forecasting the Movement of NIFTY50As previously mentioned, the NIFTY50 index is in the process of completing a diametric pattern. The news of the U.S. imposing tariffs on imports from India has already impacted the chart. Therefore, I believe the g-wave of the diametric will transform into a reverse contracting triangle, and the ant
About Nifty 50 Index
NIFTY 50 is the main index for the National Stock Exchange of India (NSE). It tracks the performance of the top 50 stocks by market capitalization from 13 sectors of the Indian economy. With such a relatively small number of companies within the index it still represents over 60% of the free float market capitalization of the stocks listed on NSE, and serves as a benchmark for fund portfolios and index funds. The list of the NIFTY 50 Index constituents is rescheduled every 6 month.
Related indices
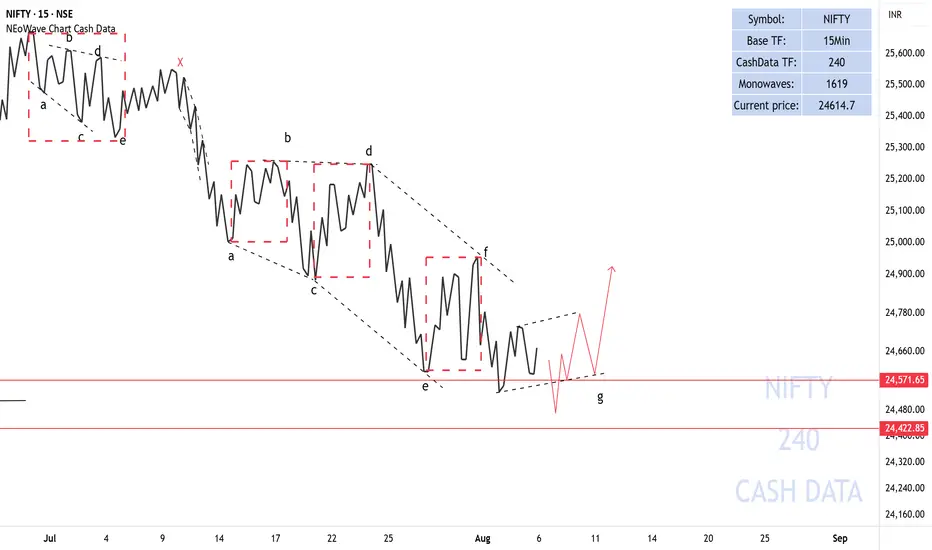
NIFTY50.....Miss a final sell-off! Part III!Hello Traders,
the NIFTY50 declined this week about ~370 points. That was inline with my expectations, and it also touched the sky-blue rectangle, to see at the chart! At the past two weeks, a loss of nearly 640 points!
Whether there will be a "final sell-off" at the start of a longer lasting corre

NIFTY AUGUST 2ND WEEK ANALYSISNifty can complete a retracement cycle this week, and we can expect upside momentum in the upcoming week. No major downside is expected beyond 24000. If the index fails to resume upside, then below marked levels can trigger strong short covering. On the upside, 24480 is the level from which we can e

Nifty levels - Aug 12, 2025Nifty support and resistance levels are valuable tools for making informed trading decisions, specifically when combined with the analysis of 5-minute timeframe candlesticks and VWAP. By closely monitoring these levels and observing the price movements within this timeframe, traders can enhance the

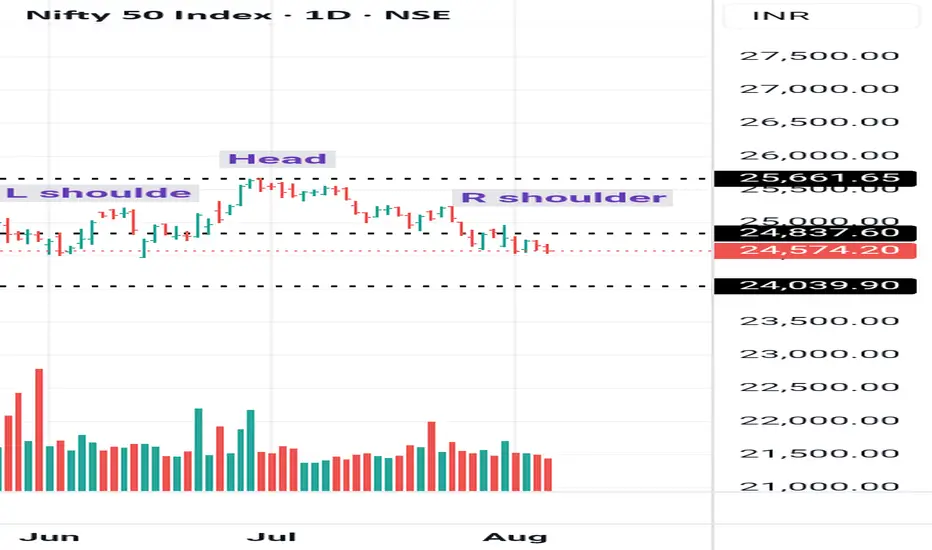
Nifty breakdown of HS patternNifty 24570 has broken down of H S pattern.technical target 24080.indicator is negatively diverged.volume falls with price.fii's have sold contracts and negetive in derivatives.we expect nifty will move down further with resistance at 24837
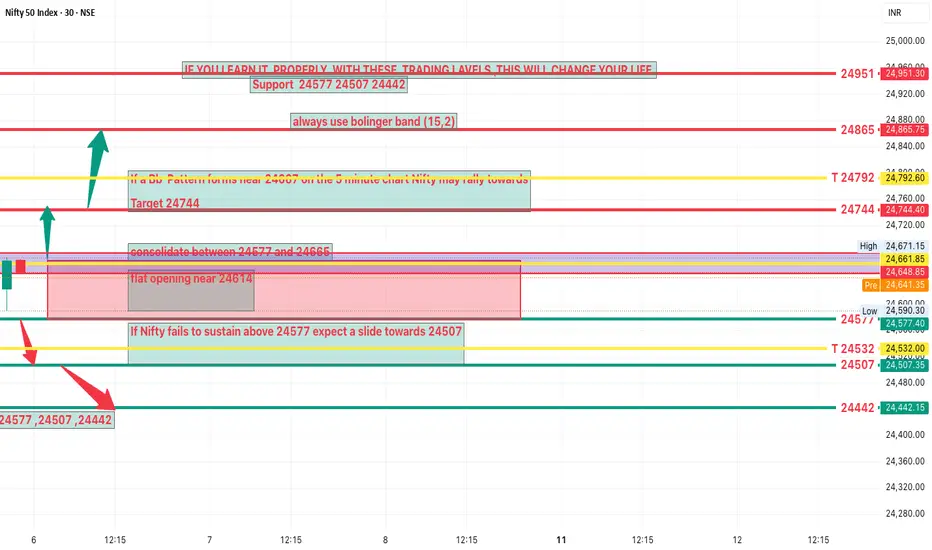
NIFTY Analysis 6 AUGUST, 2025 ,Morning update at 9 amDue to uncertainty in US tariffs on India short covering is unlikely
This global factor could lead to a flat opening near 24614
Expected Intraday Range
Likely to consolidate between 24577 and 24665
Upside Scenario
If a bb Pattern forms near 24666 on the 5 minute chart Nifty may rally towards
Targe
Intraday Setup for Tuesday 05 August Market Structure Over Sentiment
The market is currently trading in a confusing zone, especially with negative global sentiment in the backdrop. But remember — that sentiment only matters if the Friday hourly low breaks. Until then, stay technical, stay objective
🧭 Market Structure Overview:
Daily

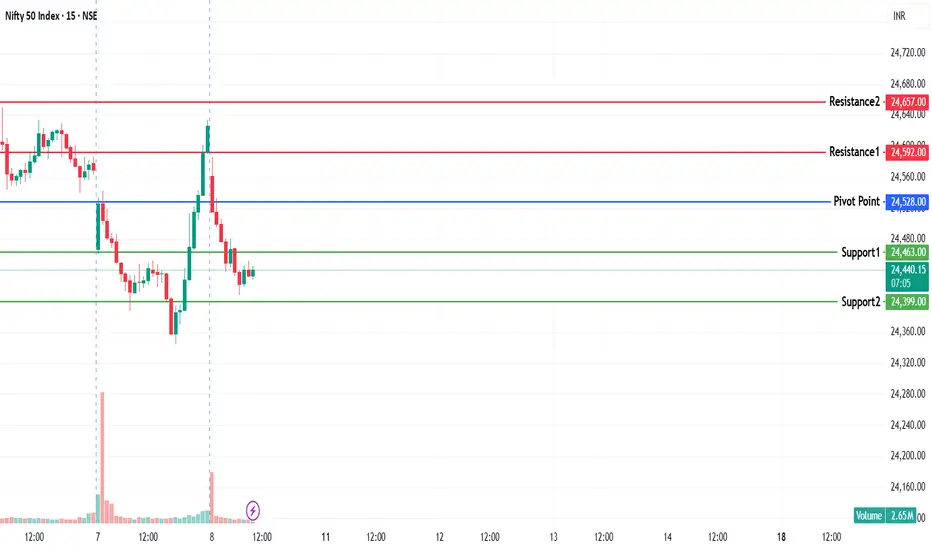
NIFTY KEY LEVELS FOR 08.08.2025NIFTY KEY LEVELS FOR 08.08.2025
Apologies for the delay in sharing this..
If the candle stays above the pivot point, it is considered a bullish bias; if it remains below, it indicates a bearish bias. Price may reverse near Resistance 1 or Support 1. If it moves further, the next potential reversal
NIFTY50.....Miss a final sell-off! Part IIHello Traders,
the NIFTY50 is on track with my forecast! It declined over the course of the week to a level of 24565 points - a loss of almost 271 points, (nearly 1.09%).
The question is, if N50 is declining lower in the coming week. The question is, to what degree will it decline ?
Chart analysis

Nifty Analysis - WeeklyWith simple Monthly OHLC setup - Here is the Nifty's current support for the coming week.
23935 is the level where Sharks have laid their bet.
If 23935 falls for gaining support this time then the next level is at 22195 - 21965

See all ideas
Summarizing what the indicators are suggesting.
Oscillators
Neutral
SellBuy
Strong sellStrong buy
Strong sellSellNeutralBuyStrong buy
Oscillators
Neutral
SellBuy
Strong sellStrong buy
Strong sellSellNeutralBuyStrong buy
Summary
Neutral
SellBuy
Strong sellStrong buy
Strong sellSellNeutralBuyStrong buy
Summary
Neutral
SellBuy
Strong sellStrong buy
Strong sellSellNeutralBuyStrong buy
Summary
Neutral
SellBuy
Strong sellStrong buy
Strong sellSellNeutralBuyStrong buy
Moving Averages
Neutral
SellBuy
Strong sellStrong buy
Strong sellSellNeutralBuyStrong buy
Moving Averages
Neutral
SellBuy
Strong sellStrong buy
Strong sellSellNeutralBuyStrong buy
Displays a symbol's price movements over previous years to identify recurring trends.
Frequently Asked Questions
The current value of Nifty 50 Index is 24,487.40 INR — it has fallen by −0.40% in the past 24 hours. Track the index more closely on the Nifty 50 Index chart.
Nifty 50 Index reached its highest quote on Sep 27, 2024 — 26,277.35 INR. See more data on the Nifty 50 Index chart.
The lowest ever quote of Nifty 50 Index is 279.00 INR. It was reached on Jul 3, 1990. See more data on the Nifty 50 Index chart.
Nifty 50 Index value has decreased by −0.94% in the past week, since last month it has shown a −3.04% decrease, and over the year it's increased by 0.69%. Keep track of all changes on the Nifty 50 Index chart.
The top companies of Nifty 50 Index are NSE:RELIANCE, NSE:HDFCBANK, and NSE:TCS — they can boast market cap of 214.04 B INR, 174.71 B INR, and 125.46 B INR accordingly.
The highest-priced instruments on Nifty 50 Index are NSE:MARUTI, NSE:ULTRACEMCO, and NSE:BAJAJ_AUTO — they'll cost you 12,840.00 INR, 12,449.00 INR, and 8,196.50 INR accordingly.
The champion of Nifty 50 Index is NSE:BAJFINANCE — it's gained 28.87% over the year.
The weakest component of Nifty 50 Index is NSE:INDUSINDBK — it's lost −41.99% over the year.
Nifty 50 Index is just a number that lets you track performance of the instruments comprising the index, so you can't invest in it directly. But you can buy Nifty 50 Index futures or funds or invest in its components.
The Nifty 50 Index is comprised of 50 instruments including NSE:RELIANCE, NSE:HDFCBANK, NSE:TCS and others. See the full list of Nifty 50 Index components to find more opportunities.