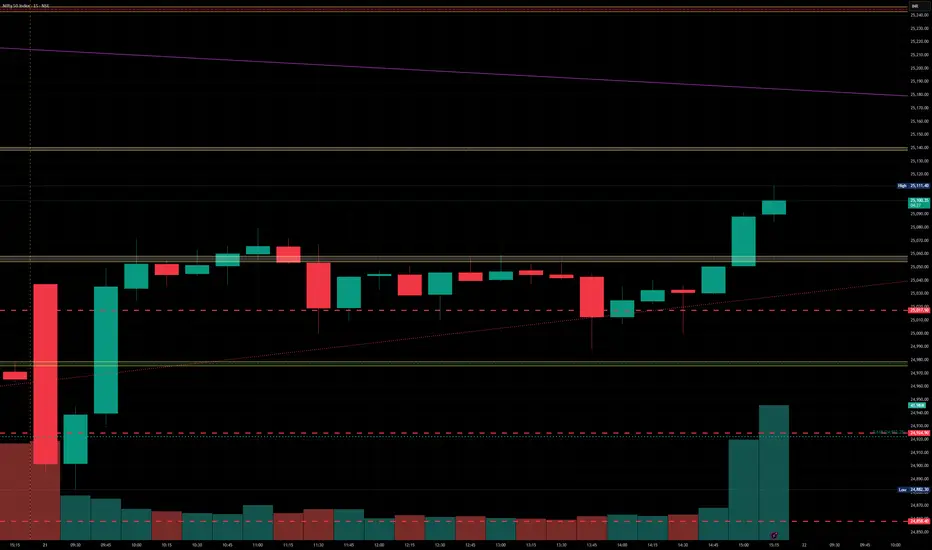
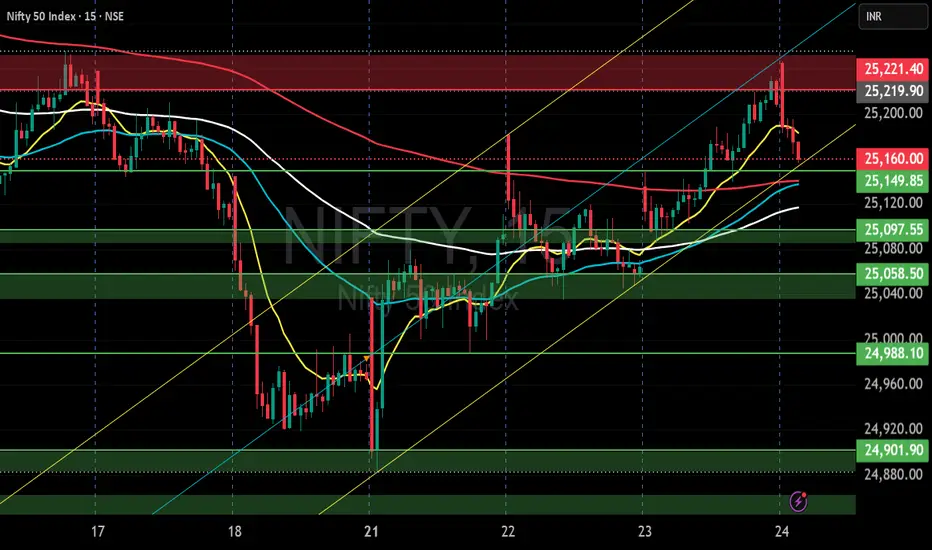
Todays nifty market analysis.if nifty sustains above 25150 expecting a target of 25225.
you can expect a bearish momentum below 25118. Target will be 25050.
NIFTY trade ideas

#nifty directions and levels for July 24Good morning, friends! 🌞
Here are the market directions and levels for July 24th:
The global market is showing a moderately bullish sentiment.
Meanwhile, the local market is also exhibiting a moderately bullish tone.
Today, Gift Nifty indicates a gap-up opening of around 60 points.
What can we expect today?
In the previous session, both Nifty and Bank Nifty took a solid pullback.
At the same time, the open interest also shifted to the bullish side.
So, if the gap-up sustains, we can expect the pullback continuation.
Also, as it’s a new moon day(for south), some volatility can be expected.
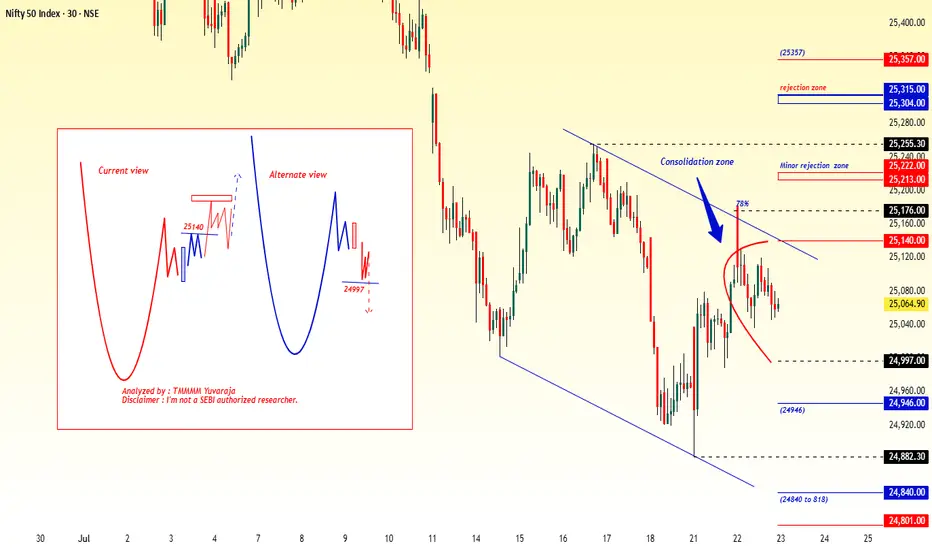
Let’s look at the charts:
Current View:
The current view suggests that, as mentioned above,
if the gap-up sustains, we can expect a rally continuation with some consolidation.
In this case, the parameters are showing slight strength,
so the rejection zone may act just around the minor resistance.
Alternate View:
The alternate view suggests that
if the gap-up does not sustain or if the market rejects near immediate resistance with a solid reversal,
then we can expect a minor correction of around 23% to 38%.
However, unless the market breaks below the 38% level,
we cannot confirm a reversal into a bearish trend.

#Nifty directions and levels for July 21st:Good morning, friends! 🌞
Here are the market directions and levels for July 21st:
The global market shows no major changes and continues to maintain a moderately bearish sentiment.
Meanwhile, the local market is exhibiting a bearish tone. Today, Gift Nifty indicates a neutral to slightly gap-down start,
around 30 points negative.
What can we expect today?
In the previous session, both Nifty and Bank Nifty fell sharply. Structurally, the trend remains negative.
However, due to major firms' results, we might see some volatility in the first half, possibly leading to initial speculation.
That said, as per the structure my expectation is a continuation of the correction that's my current view
The alternate view is If the market takes an initial pullback, we could see a 23–38% retracement in the minor swing. Even in this scenario, the bias remains bearish unless the 38% Fibonacci level is broken.
A break above 38% could extend the pullback toward the 50–78% levels.

NIFTY50.....Where are the targets?Hello Traders,
The NFTY50 failed to make new high's, but has achieved my long-term target @25577 points.
It also broke below the trend-line, connecting the high's of 25116 to 25222. This is a bearish sign!
I have labelled the chart as a w-x-y pattern, that could also morph into an a-b-c!
But what to expect for the coming sessions?
Chart analysis.
The weakness at chart is not done to my view!
In normal, a corrective move, here a possible wave ((iv)), pink, will return to a wave 4 of lower degree. So we should expect a target range at or around the 24000 points! If so to come, this would be potentially buy_area! A break to the upside is not in (my) the cards. Too much overlapping waves, buy and immediately sell-orders..... This is not how an impulse look like!
Of course; a wave iv correction can morph into a w-x-y pattern. And if so, the price would extend to an 2.618 Fibo after it was complete!
Again. The correction look like not complete, and it will be interesting how markets will answer on Monday.
So, that's it for today!
Have a great weekend.....
Ruebennnase
Please ask or comment as appropriate.
Trade on this analysis at your own risk.

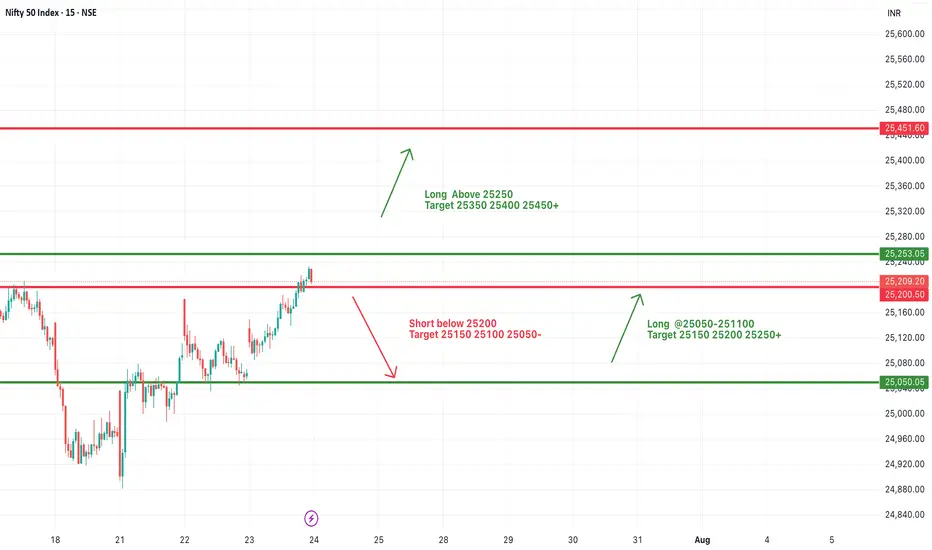
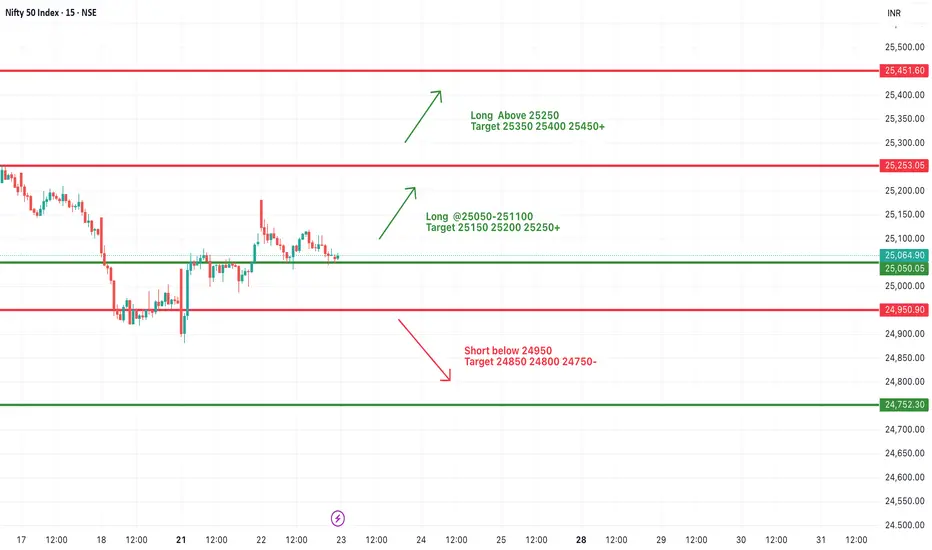
#NIFTY Intraday Support and Resistance Levels - 24/07/2025Nifty is expected to open with a bullish gap-up today, breaching the 25,250 resistance zone. This level has been acting as a consolidation ceiling in recent sessions, and today’s opening above it indicates strong buying momentum in the market.
If Nifty sustains above 25,250, we may witness a fresh upside rally towards the immediate targets of 25,350, 25,400, and 25,450+. A decisive breakout above this zone would mark the continuation of the upward trend and may attract aggressive long-side participation.
On the downside, if Nifty slips and sustains below 25,200–25,250, weakness could resume. A break below 25,200 may lead to a correction toward 25,150, 25,100, and possibly even 25,050-, which will now act as a crucial support zone.
Overall, today's session may remain bullish above 25,250 with momentum trades favored on the long side.
#Nifty directions and levels for July 22nd:Good morning, friends! 🌞
Here are the market directions and levels for July 22nd:
The global market shows no major changes and continues to maintain a moderately bearish sentiment.
Meanwhile, the local market is exhibiting a moderately bullish tone. Today, Gift Nifty indicates a gap-up opening of around 100 points.
What can we expect today?
In the previous session, both Nifty and Bank Nifty experienced a pullback and managed to sustain it. However, structurally, the trend remains bearish in the lower time frame. So, how should we interpret this sentiment?
1, Since there’s no clear direction, if the market faces rejection initially, we can expect minor consolidation within the 38% Fibonacci range.
2, On the other hand, if it sustains the gap-up and breaks the immediate resistance with a solid structure, we can follow the direction for further upside.

#Nifty directions and levels for July 23rd:Good morning, friends! 🌞
Here are the market directions and levels for July 23rd:
The global market shows no major changes and continues to maintain a moderately bearish sentiment.
Meanwhile, the local market is exhibiting a moderately bullish tone. Today, Gift Nifty indicates a gap-up opening of around 60 points.
What can we expect today?
In the previous session, both Nifty and Bank Nifty couldn't sustain the gap-up start. Structurally, we are still in an unclear zone.
However, my expectation is that today’s market may take some consolidation after the gap-up start.
Looking at the chart, the current view suggests:
* If the market sustains the gap-up and breaks the immediate resistance, we can expect the pullback to continue with a moderately bullish tone.
Alternate view:
* If the gap-up doesn’t sustain and the market declines initially, it may reach the immediate support level.
* If a pullback happens from there, we can expect a range-bound market.
* Conversely, if the support breaks, the correction is likely to continue.
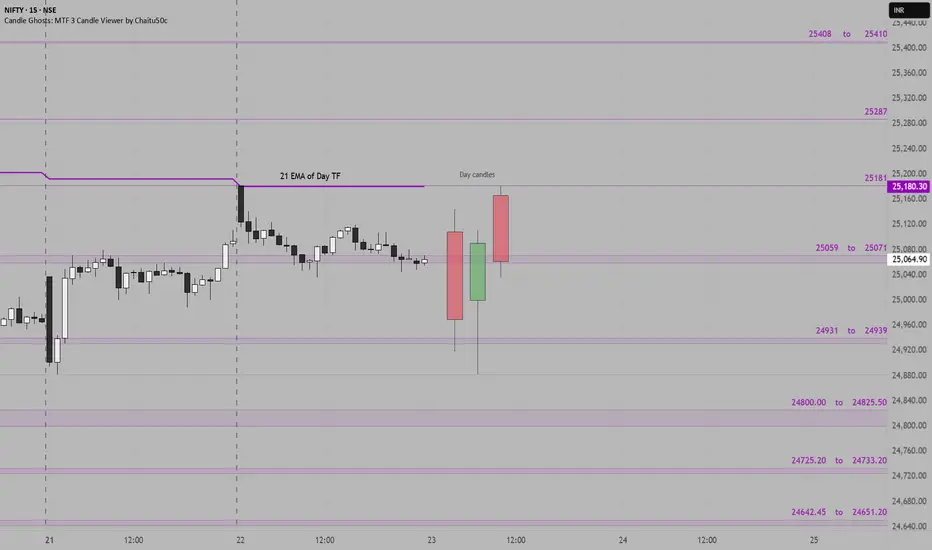
Nifty Support & Resistance Zones for 23rd July 2025The following support and resistance zones have been identified for Nifty based on recent price structure, candle reactions, and high-activity price clusters:
Resistance Zones:
25408 – 25410
25287
25181
25059 – 25071
Support Zones:
24931 – 24939
24800 – 24825.50
24725.20 – 24733.20
24642.45 – 24651.20
Yesterday Nifty formed a strong bullish day candle after testing support near 24800, showing signs of recovery. If the price holds above 25070, we may see a move toward 25181 and possibly 25287.
These levels act as potential zones of reaction and should be used with confirmation via price action or volume triggers during live market.
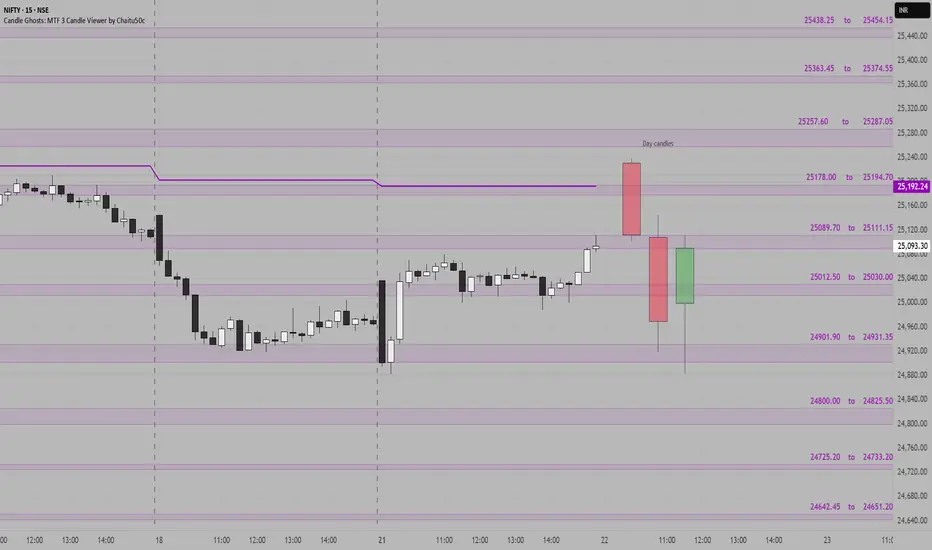
NIFTY SUPPORT & RESISTANCE ZONES FOR 22-07-2025Nifty Support & Resistance Zones for Tomorrow 22-07-2025
Based on price cluster analysis and recent market structure, the following key support and resistance levels have been identified for the upcoming session:
Resistance Zones:
25438.25 – 25454.15
25363.45 – 25374.55
25257.60 – 25287.05
25178.00 – 25194.70
25089.70 – 25111.15
Support Zones:
25012.50 – 25030.00
24901.90 – 24931.35
24800.00 – 24825.50
24725.20 – 24733.20
24642.45 – 24651.20
These levels are derived from high-probability zones where price has shown repeated interaction in the recent past. Watch how Nifty reacts at these zones for potential breakout, reversal, or pullback setups.
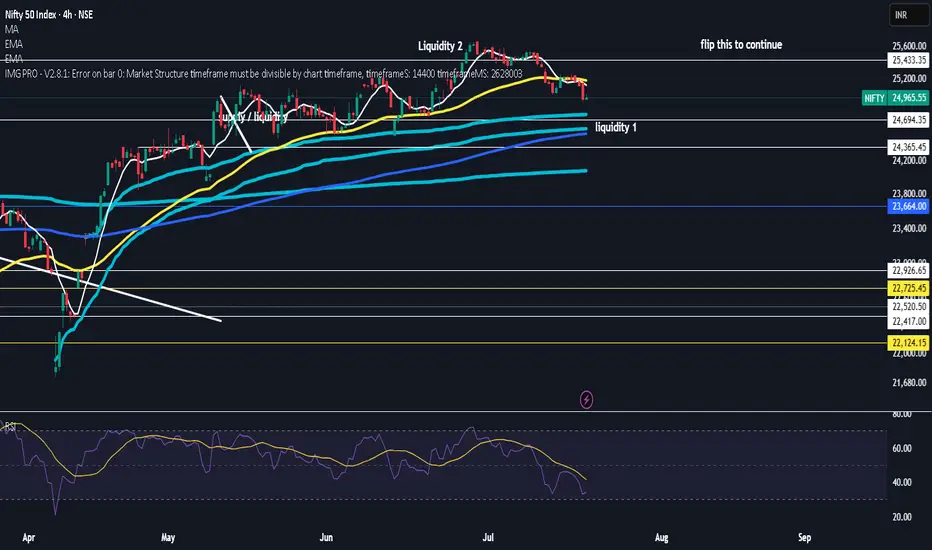
$nifty50took first liquidity and deviated back
now we take liquidty under vwap or not but good spot to reverse here
ATH incoming
rsi looks nice and reset
wont be suprized if we range here for a bit before blasting through
#Nifty directions and levels for July 17thGood morning, Friends! 🌞
Here are the market directions and levels for July 17th:
There have been no major changes in the global market; it continues to maintain a moderately bearish sentiment.
Meanwhile, our local market is showing a moderately bullish tone on the lower time frame. Today, Gift Nifty is indicating a neutral to slightly gap-up start.
So, what can we expect today?
In the previous session, both Nifty and Bank Nifty moved with ups and downs. Structurally, the sentiment still remains the same.
Even if the market opens with a gap-up, we can expect some rejection near immediate resistance.
So, my expectation is that the market may behave similarly to the previous session.
If it starts with a pullback, we may see rejection afterward.
On the other hand, if it starts with a decline, we can expect a pullback later.
The key point to note is that clear directional moves are likely only if a strong candle forms after consolidation.

#NIFTY Intraday Support and Resistance Levels - 23/07/2025Nifty is expected to open with a gap-up today, continuing its sideways movement within a tight range. There are no significant changes in key levels from the previous session, indicating a consolidative phase in the market. Price action near these levels will be crucial for intraday direction.
On the upside, a bullish continuation can be expected if Nifty sustains above 25,050–25,100. This zone has been acting as a breakout point, and a sustained move above can lead to an intraday rally toward 25,150, 25,200, and 25,250+. Further strength will be confirmed if Nifty crosses 25,250, opening the possibility to test 25,350, 25,400, and even 25,450+ levels.
On the downside, if Nifty breaks below 24,950, it may trigger a short setup with potential downside targets of 24,850, 24,800, and 24,750-. This breakdown would indicate weakness, especially if it comes with volume.
Wkly Market Wrap: Nifty Under Pressure, S&P 500 Hits Record HighThe Nifty 50 closed the week at 24,968, down 180 points from the previous week's close. It traded within a tight range, posting a high of 25,255 and a low of 24,918—perfectly aligning with the range I’ve been tracking between 25,600 and 24,700.
As I’ve been highlighting over the past few weeks, the monthly chart continues to show weakness, and now even the weekly chart is starting to reflect bearish signals. This growing weakness is a notable concern.
What to Watch for Next Week:
If Nifty sustains above 25,100, we could see a potential rebound toward the 25,400–25,450 resistance zone.
However, a breakdown below this week's low of 24,918 opens the door to a retest of key support near 24,500.
What’s interesting is that, despite Nifty’s indecision, the number of bullish stocks on the monthly time frame has increased significantly. Last week, there were 18 such stocks on my radar; now that number has jumped to 26, even after excluding about 10 others that showed bullish patterns but had high volatility.
This divergence—index showing weakness while quality stocks turn bullish—could indicate a possible bear trap being set by institutional players. If true, we might see a sharp short-covering rally after a final shakeout.
Nifty Outlook:
For the upcoming week, I expect Nifty to remain range-bound between 25,400 and 24,500. A decisive breakout or breakdown from this range could lead to sharp directional movement, so traders should stay alert.
Global Markets: S&P 500 Soars to New Highs
The S&P 500 closed at a record high of 6,296, with a weekly high of 6,315 and low of 6,201. The index remains in strong uptrend mode.
A breakout above 6,315 could see it testing 6,376, 6,454, and potentially 6,500 in the coming sessions.
My next major Fibonacci target is 6,568.
As long as 6,149 holds on a weekly closing basis, I continue to view every dip as a buying opportunity.
Final Thoughts:
The Indian markets are sending mixed signals, with the broader index showing caution while individual stock strength is quietly building. This divergence warrants a tactical approach—stay nimble, respect levels, and be ready for sharp reversals or breakouts.
Next week could be crucial. Stay focused, stay disciplined.

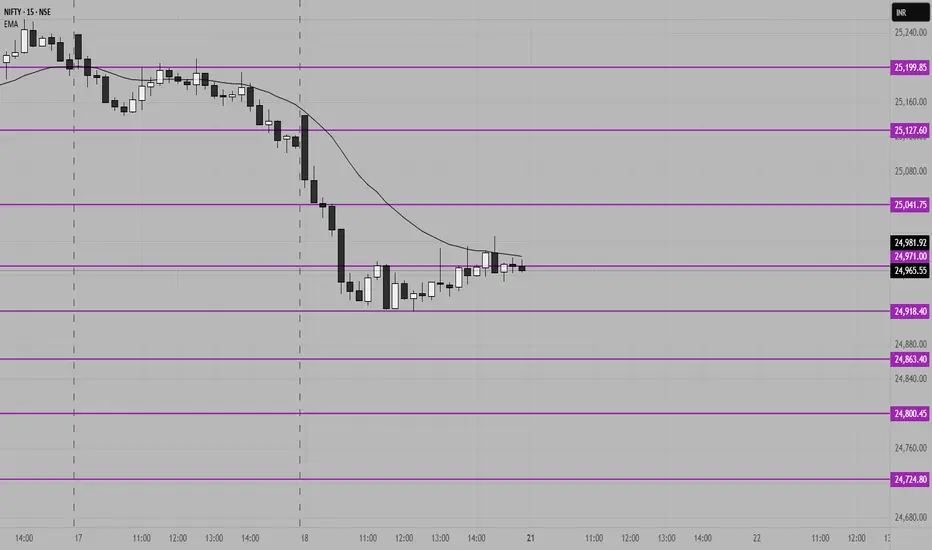
Nifty key Support and resistance levels for 21st July 2025NIFTY Key Support & Resistance for July 21st
Chart Overview:
NIFTY might consolidate after a sharp fall, currently trading around the 24,918–24,965 zone on the 15-minute chart. The price is hovering below the EMA, indicating weak momentum and hesitation in recovery.
Key Levels:
Major Resistance:
25,200 – Strong resistance zone; multiple rejections expected if tested. Watch for possible reversals or fake breakouts near this level.
Other Resistances:
* 25,127
* 25,041
Immediate Supports:
* 24,918
* 24,863
* 24,724
Outlook for July 21st:
* Failure to sustain above 24,970 could invite fresh selling toward 24,724.
* Range-bound action likely between 25,041 and 24,863 unless a strong breakout occurs.
---
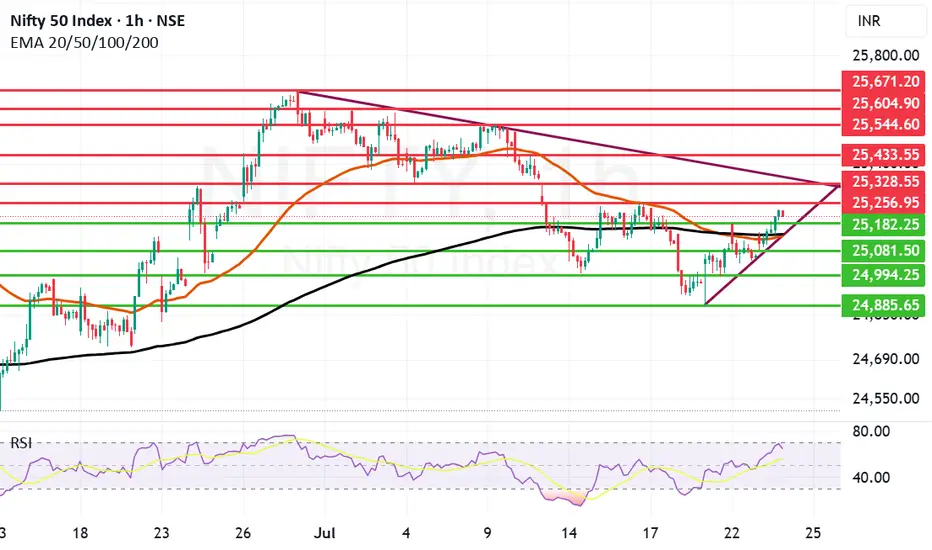
Strong Comeback by Nifty few Resistances ahead.Nifty made a remarkable comeback today ending 159 points up closing at 25219. Infosys has posted better than expected result and as of now the Infosys ADR is up by 1.26%. So if there is a turnaround in the IT sector we can see Nifty fly upwards.
The next resistance ahead of Nifty is at 25256 if we get a closing above this the next will be at 25328. These 2 will be critical resistances to cross. Once we get a closing above 25328 Nifty can target 25433 and 25544. Above 25544 Nifty becomes very strong. In case Nifty is not able to cross 25256 or 25328 levels the supports for Nifty are at 25182. After this zone there is a dual support of Mother and Father line of Hourly chart at 25136 and 25142.
These are very strong supports. (Thus the zone between 25182 to 25136 is full of supports). We hope that these supports are held. In case we get a closing below 25136 Nifty will again fall into bearish territory and can plunge towards 25081, 24994 or even 24885.
The shadow of the candles right now is positive but 2 very important resistances mentioned earlier are yet to crossed so game is in balance but only slightly in favour of Bulls.
Disclaimer: The above information is provided for educational purpose, analysis and paper trading only. Please don't treat this as a buy or sell recommendation for the stock or index. The Techno-Funda analysis is based on data that is more than 3 months old. Supports and Resistances are determined by historic past peaks and Valley in the chart. Many other indicators and patterns like EMA, RSI, MACD, Volumes, Fibonacci, parallel channel etc. use historic data which is 3 months or older cyclical points. There is no guarantee they will work in future as markets are highly volatile and swings in prices are also due to macro and micro factors based on actions taken by the company as well as region and global events. Equity investment is subject to risks. I or my clients or family members might have positions in the stocks that we mention in our educational posts. We will not be responsible for any Profit or loss that may occur due to any financial decision taken based on any data provided in this message. Do consult your investment advisor before taking any financial decisions. Stop losses should be an important part of any investment in equity.
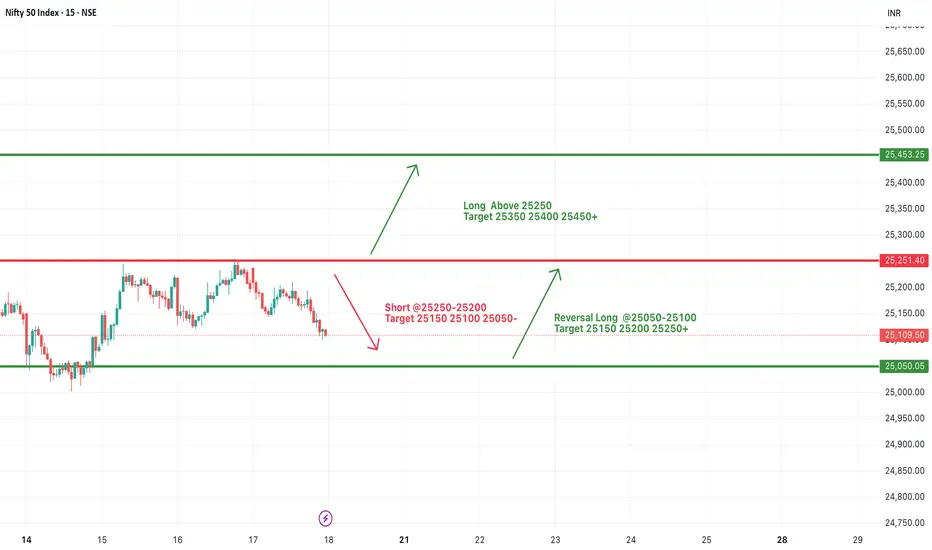
#NIFTY Intraday Support and Resistance Levels - 18/07/2025Nifty is likely to open slightly gap-up today near the 25100–25150 zone. There are no major changes from yesterday’s levels, so the same trading levels remain in focus for today’s session. If Nifty sustains above the 25250 level, we can expect an upside move toward 25350, 25400, and even 25450+ levels. This area remains a crucial resistance zone for potential bullish continuation.
On the downside, if Nifty fails to cross and sustain above 25250 and breaks below the 25200–25250 zone, we may witness a downward move with possible targets at 25150, 25100, and 25050.
A reversal long opportunity may arise in the 25050–25100 support zone if the market finds buying interest after a dip. From this level, we can expect targets around 25150, 25200, and 25250+.
The index is trading in a tight range with no fresh cues. Avoid aggressive entries and stick to level-based trades with strict stop-loss and partial profit booking.
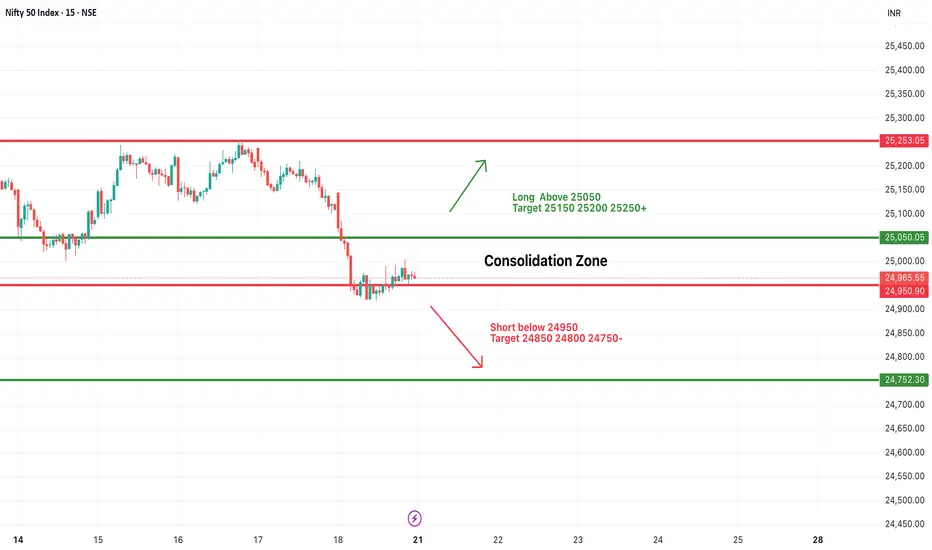
#NIFTY Intraday Support and Resistance Levels - 21/07/2025Nifty is likely to start the day with a flat opening, as current price action is indicating a consolidation phase near the lower range. The zone between 24,950–25,050 is acting as a key area of indecision, where prices are stuck in a tight range, showing a lack of clear momentum. This consolidation could lead to a breakout or breakdown depending on how the index reacts at key levels.
If Nifty sustains above 25,050, it may trigger a short-term upward move, breaking the consolidation phase. In such a scenario, an upside rally towards 25,150, 25,200, and 25,250+ levels can be expected, making it a favorable long setup for intraday traders.
On the contrary, if the index slips below 24,950, the selling pressure may increase, and downside momentum can accelerate. A breakdown here could pull the index towards support levels of 24,850, 24,800, and even 24,750-, which would confirm bearish strength.
Traders are advised to avoid aggressive positions within the consolidation zone and wait for a breakout or breakdown for directional trades. Quick entries with partial profit booking at every level and strict stop-losses are recommended to manage risk efficiently in today’s range-bound environment.
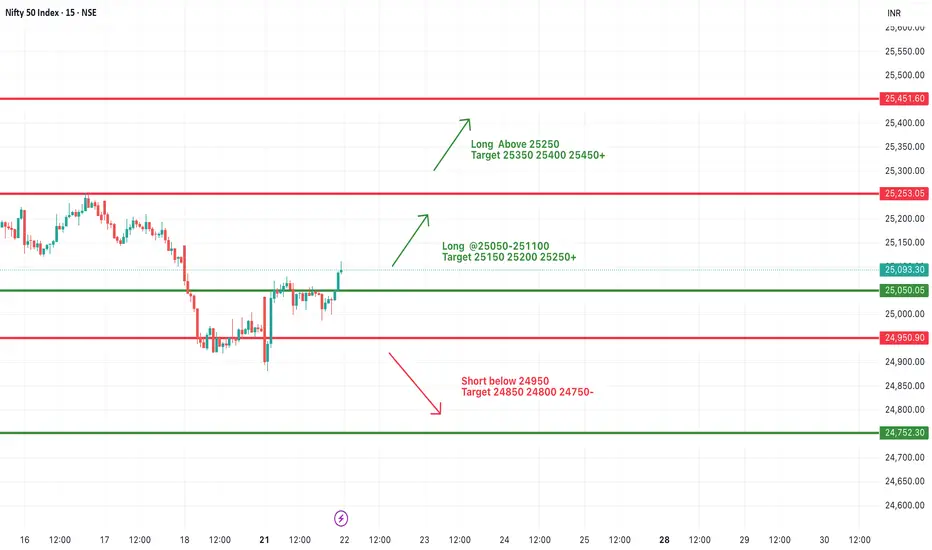
#NIFTY Intraday Support and Resistance Levels - 22/07/2025Today, Nifty is expected to open slightly gap-up, indicating positive early sentiment. After breaking out from the previous day’s consolidation zone, the index has shown strength around the 25,050 level, which will now act as an important intraday support. If this level is held during the early session, we can expect further upside continuation.
A move above the 25,050–25,100 zone can trigger upward momentum with potential targets at 25,150, 25,200, and 25,250+. Sustained strength above 25,250 will open the door for further bullish moves toward 25,350, 25,400, and 25,450+, making it a favorable long scenario for trending market conditions.
However, if the index fails to hold above the 25,050 level and starts trading back below 24,950, it may again enter a bearish territory. In such a case, downside targets of 24,850, 24,800, and 24,750- are possible, indicating weakness and reversal from resistance.
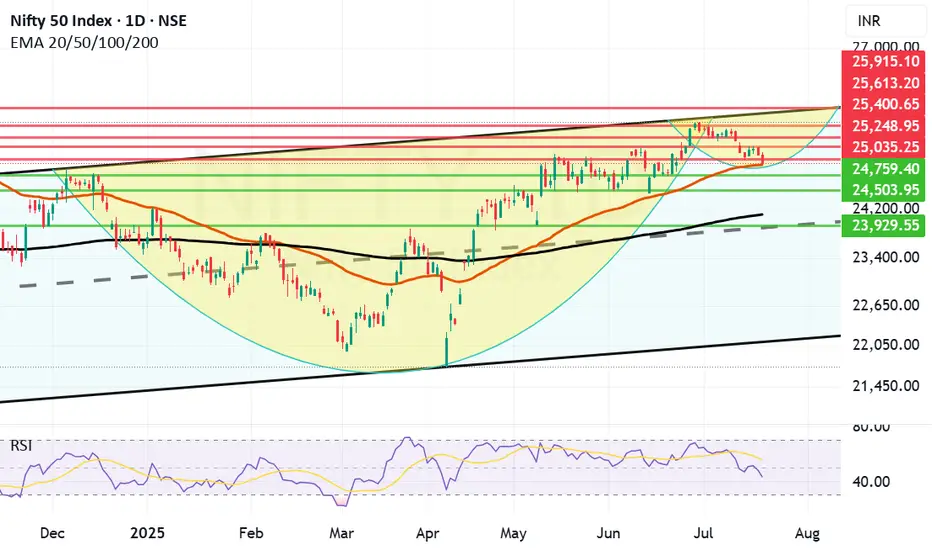
Can Reliance and Banks turn Nifty around? do or die Monday. Nifty as of now has taken support at Mother line in daily chart. As expected in my Yesterday's message. So Hopefully if Big Banks Results are in line tomorrow we might see Nifty going upwards from Monday.
Mota Bhai just announced the results. EBITDA is slightly less than expected but Net Profit and Revenue is much better than Market expectation. In my view market should react positively to this result.
Supports For Nifty remain at 24932 (Mother line), 24759, 24503. As indicated earlier if we get a closing below 24503 we may see a Fall towards 24106 or 23929 (In unlikely circumstances).
Nifty Resistances remain at: 25035, 25248, 25400 and 25613 (Channel top Resistance).
Results for tomorrow
HDFC BANK
ICICIBANK
AUSMALL BANK
RBL BANK
UNION BANK
YES BANK
CENTR BANK
PUNJA BANK
CENTR BANK
So it seems like a Do or Die Monday on cards. Shadow of the candle looks neutral as of now.
Disclaimer: The above information is provided for educational purpose, analysis and paper trading only. Please don't treat this as a buy or sell recommendation for the stock or index. The Techno-Funda analysis is based on data that is more than 3 months old. Supports and Resistances are determined by historic past peaks and Valley in the chart. Many other indicators and patterns like EMA, RSI, MACD, Volumes, Fibonacci, parallel channel etc. use historic data which is 3 months or older cyclical points. There is no guarantee they will work in future as markets are highly volatile and swings in prices are also due to macro and micro factors based on actions taken by the company as well as region and global events. Equity investment is subject to risks. I or my clients or family members might have positions in the stocks that we mention in our educational posts. We will not be responsible for any Profit or loss that may occur due to any financial decision taken based on any data provided in this message. Do consult your investment advisor before taking any financial decisions. Stop losses should be an important part of any investment in equity.
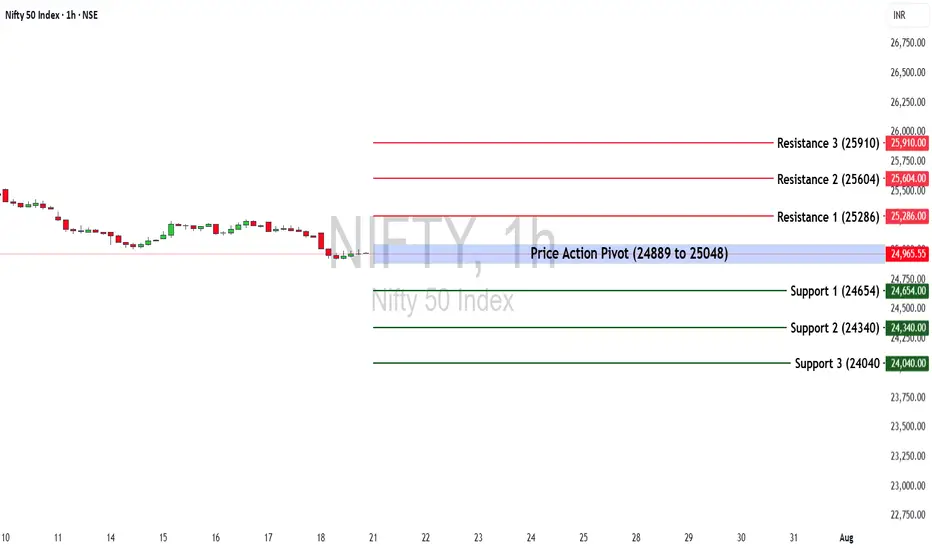
Nifty 50 at a Turning Point? Key Levels & Market Outlook AheadThe Nifty 50 ended the week at 25,149.85, posting a loss of -1.22%.
🔹 Key Levels for the Upcoming Week
📌 Price Action Pivot Zone:
24,889 to 25,048 – This is a crucial range to monitor for potential trend reversals or continuation. A breakout or breakdown from this zone can set the tone for the week.
🔻 Support Levels:
S1: 24,654
S2: 24,340
S3: 24,040
🔺 Resistance Levels:
R1: 25,286
R2: 25,604
R3: 25,910
📈 Market Outlook
✅ Bullish Scenario:
A sustained move above 25,048 (top of the pivot zone) may invite buying interest. If momentum continues, the index could test R1 (25,286) and possibly extend towards R2 (25,604) and R3 (25,910).
❌ Bearish Scenario:
Failure to hold the pivot zone and a breakdown below 24,889 could trigger further downside. The index may slide towards S1 (24,654) and deeper supports at S2 (24,340) and S3 (24,040).
Disclaimer: lnkd.in
NIFTY S/R for 24/7/25Support and Resistance Levels:
Support Levels: These are price points (green line/shade) where a downward trend may be halted due to a concentration of buying interest. Imagine them as a safety net where buyers step in, preventing further decline.
Resistance Levels: Conversely, resistance levels (red line/shade) are where upward trends might stall due to increased selling interest. They act like a ceiling where sellers come in to push prices down.
Breakouts:
Bullish Breakout: When the price moves above resistance, it often indicates strong buying interest and the potential for a continued uptrend. Traders may view this as a signal to buy or hold.
Bearish Breakout: When the price falls below support, it can signal strong selling interest and the potential for a continued downtrend. Traders might see this as a cue to sell or avoid buying.
MA Ribbon (EMA 20, EMA 50, EMA 100, EMA 200) :
Above EMA: If the stock price is above the EMA, it suggests a potential uptrend or bullish momentum.
Below EMA: If the stock price is below the EMA, it indicates a potential downtrend or bearish momentum.
Trendline: A trendline is a straight line drawn on a chart to represent the general direction of a data point set.
Uptrend Line: Drawn by connecting the lows in an upward trend. Indicates that the price is moving higher over time. Acts as a support level, where prices tend to bounce upward.
Downtrend Line: Drawn by connecting the highs in a downward trend. Indicates that the price is moving lower over time. It acts as a resistance level, where prices tend to drop.
Disclaimer:
I am not a SEBI registered. The information provided here is for learning purposes only and should not be interpreted as financial advice. Consider the broader market context and consult with a qualified financial advisor before making investment decisions.
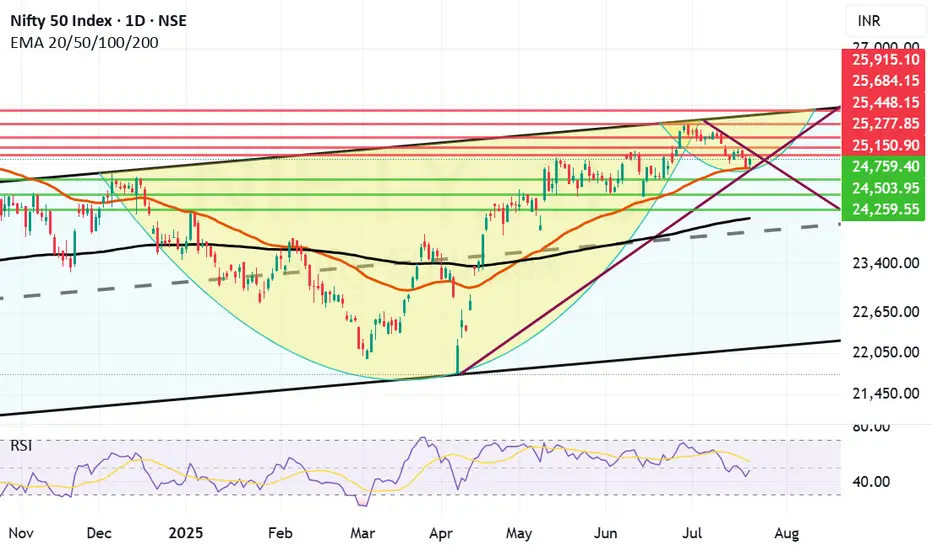
Nifty has taken support at Mother line as expected.Despite poor showing by Reliance post result and TCS continuing to fall Nifty staged a remarkable comeback on the back of Pvt Sector banking which did well. Bank Nifty came back strongly posting 1.19% gains today which enabled Nifty to rise 122 points or 0.49%. Capital Goods, Finance and Metals indices also gained more than 1% each.
Resistances for Nifty now remain at: 25150, 25277 (Trend line resistance), 25448, 25684 and finally channel top resistance at 25915.
Supports for Nifty remain at: 24938 (Mother Line Support of Daily Chart), 24759, 24503, 24259 and finally 24116 (Father Line support of Daily chart).
Shadow of the candle right now is neutral to positive and RSI is 47.63 with median RSI resistance at 54.09.
Disclaimer: The above information is provided for educational purpose, analysis and paper trading only. Please don't treat this as a buy or sell recommendation for the stock or index. The Techno-Funda analysis is based on data that is more than 3 months old. Supports and Resistances are determined by historic past peaks and Valley in the chart. Many other indicators and patterns like EMA, RSI, MACD, Volumes, Fibonacci, parallel channel etc. use historic data which is 3 months or older cyclical points. There is no guarantee they will work in future as markets are highly volatile and swings in prices are also due to macro and micro factors based on actions taken by the company as well as region and global events. Equity investment is subject to risks. I or my clients or family members might have positions in the stocks that we mention in our educational posts. We will not be responsible for any Profit or loss that may occur due to any financial decision taken based on any data provided in this message. Do consult your investment advisor before taking any financial decisions. Stop losses should be an important part of any investment in equity.
Nifty levels - Jul 22, 2025Nifty support and resistance levels are valuable tools for making informed trading decisions, specifically when combined with the analysis of 5-minute timeframe candlesticks and VWAP. By closely monitoring these levels and observing the price movements within this timeframe, traders can enhance the accuracy of their entry and exit points. It is important to bear in mind that support and resistance levels are not fixed, and they can change over time as market conditions evolve.
The dashed lines on the chart indicate the reaction levels, serving as additional points of significance to consider. Furthermore, take note of the response at the levels of the High, Low, and Close values from the day prior.
We hope you find this information beneficial in your trading endeavors.
* If you found the idea appealing, kindly tap the Boost icon located below the chart. We encourage you to share your thoughts and comments regarding it.
Wishing you success in your trading activities!