25171 below sustain take put optionlast 3 week exp( 5 jun, 12 jun,19) all of price touched high and low compination*
check on{ one day time frame}
5 jun -{high 24897 low 24613}
12 jun - {high 25198 low 24826}
19 jun -{high 24862 low 24733}
coming 26 jun my point of target 24862
everything mention about my chart
just is my point of view idea ,,I am not sebi reg
thank you ,,,,happy day happy profit
NIFTY trade ideas

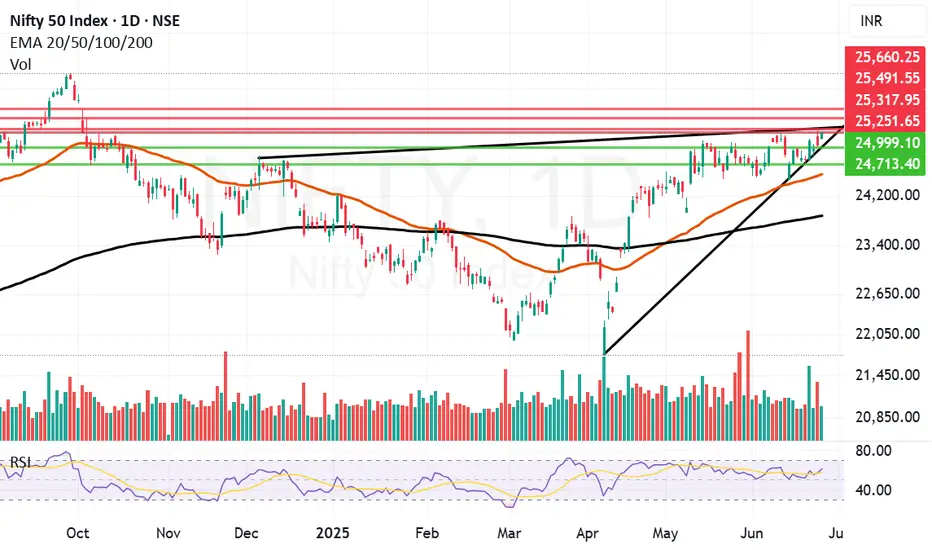
Nifty 50 Reverse Head and shoulder The Reverse Head and Shoulders is a classic bullish reversal pattern that typically signals the end of a downtrend and the beginning of an upward move. In the Nifty daily chart as of June 2025, this pattern has been observed, indicating a potential shift in market sentiment to bullish.

Final hurdle remains to be crossed before Nifty can fly further.One important final hurdle of 25251 remain just in front of Nifty before it can fly further. I can it a final hurdle because it is an important trendline resistance. Last 2 days Nifty has tried to climb above it but we did not get a closing above it yesterday and today as well. Today Nifty made a high of 24266 but closed at 25244. It could not hold on to the ground above 25251. The level is challenging but positive momentum built from today's display might allow it to close above the same. Only time will tell. Closing of this week will be very important.
Nifty resistances remain at: 25251, Closing above 25251 will empower Bulls to pull Nifty further upwards towards 25317, 25491 and 25660.
Nifty supports remain at: 24999, 24713, 24749 (Mother Line Support), 23875 (Father line support). (Closing below Father line support can bring Bears back into the game).
Disclaimer: The above information is provided for educational purpose, analysis and paper trading only. Please don't treat this as a buy or sell recommendation for the stock or index. The Techno-Funda analysis is based on data that is more than 3 months old. Supports and Resistances are determined by historic past peaks and Valley in the chart. Many other indicators and patterns like EMA, RSI, MACD, Volumes, Fibonacci, parallel channel etc. use historic data which is 3 months or older cyclical points. There is no guarantee they will work in future as markets are highly volatile and swings in prices are also due to macro and micro factors based on actions taken by the company as well as region and global events. Equity investment is subject to risks. I or my clients or family members might have positions in the stocks that we mention in our educational posts. We will not be responsible for any Profit or loss that may occur due to any financial decision taken based on any data provided in this message. Do consult your investment advisor before taking any financial decisions. Stop losses should be an important part of any investment in equity.
Hidden bullish divergence Hidden Bullish Divergence (RSI-Based) – Description
Hidden bullish divergence using the Relative Strength Index (RSI) is a technical signal that suggests the continuation of an existing uptrend. It occurs when the price makes a higher low, but the RSI makes a lower low. This pattern reveals that, despite a short-term pullback in price, the buying pressure (bullish momentum) is still strong beneath the surface.
Key Characteristics:
Price: Forms a higher low, indicating support and strength in the trend.
RSI: Forms a lower low, showing temporary weakness or an oversold condition.
Signal Type: Continuation (not reversal) – it suggests the uptrend is likely to resume.
Why It Matters:
RSI typically measures momentum. When RSI dips lower while price stays relatively strong, it shows that the market shook out weak hands but kept its bullish structure. This is a sign that buyers are still in control, and the pullback may offer a buying opportunity.
How to Use It:
Look for this setup during a pullback in an uptrend.
Confirm with trendlines, support zones, or volume.
Consider entering long trades when RSI starts to turn up from its low, confirming momentum is returning.
Summary:
Hidden bullish divergence (RSI):
Price: Higher low
RSI: Lower low
Implication: Trend likely to continue upward

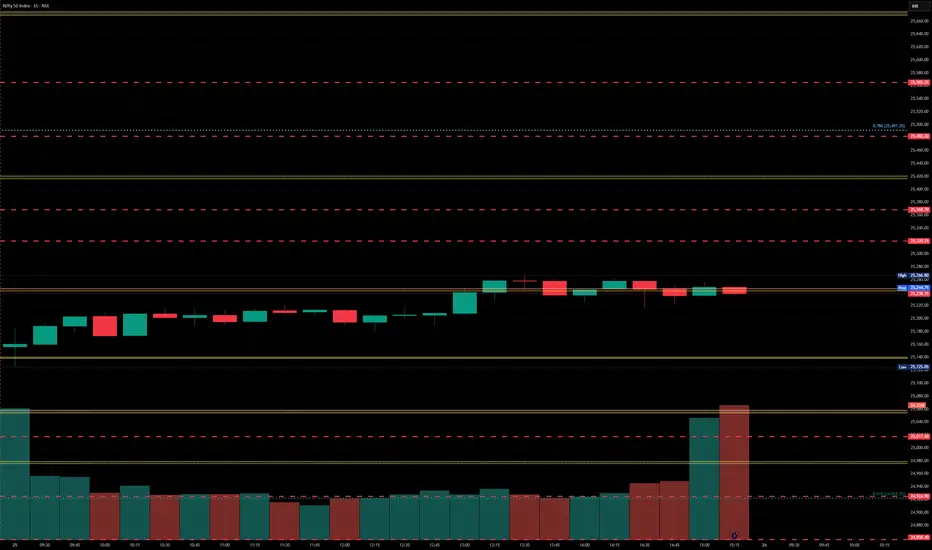
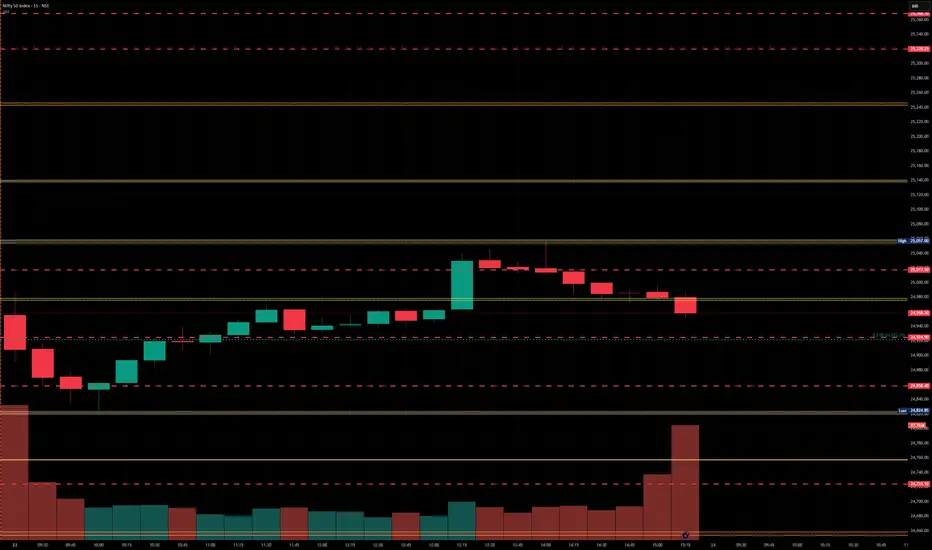
Nifty levels - Jun 26, 2025Nifty support and resistance levels are valuable tools for making informed trading decisions, specifically when combined with the analysis of 5-minute timeframe candlesticks and VWAP. By closely monitoring these levels and observing the price movements within this timeframe, traders can enhance the accuracy of their entry and exit points. It is important to bear in mind that support and resistance levels are not fixed, and they can change over time as market conditions evolve.
The dashed lines on the chart indicate the reaction levels, serving as additional points of significance to consider. Furthermore, take note of the response at the levels of the High, Low, and Close values from the day prior.
We hope you find this information beneficial in your trading endeavors.
* If you found the idea appealing, kindly tap the Boost icon located below the chart. We encourage you to share your thoughts and comments regarding it.
Wishing you success in your trading activities!
#NIFTY Intraday Support and Resistance Levels - 25/06/2025Nifty is expected to open with a gap-up near the 25,250 level, signaling early bullish strength. If the index sustains above the 25,250–25,300 zone after opening, we could see a continuation of the upward momentum toward the next resistance levels at 25,350, 25,400, and possibly 25,450+. However, if it fails to hold above 25,250 and slips back into the 25,100–25,050 zone, there could be selling pressure. A break below 25,050 may drag Nifty further down to 24,950. If 24,950 breaks, then a short trade could trigger, with targets at 24,850, 24,800, and 24,750. The key levels to watch today are 25,250 on the upside and 24,950 on the downside.

#Nifty directions and levels for June 25:Good morning, Friends! 🌞
Here are the market directions and levels for June 25:
Market Overview
The global market is showing bullish sentiment, while our local market is still maintaining a moderately bullish bias.
However, Gift Nifty is indicating a positive start of 103 points today.
So, what can we expect today?
Once again, the same thing happened in the previous session — even though the market started with a positive bias, it couldn't sustain.
Structurally, we are still in a range-bound market,
so even if the market opens positive, we can expect a correction at some point.
Let’s look at the chart for more clarity.
Both Nifty and Bank Nifty appear to be showing a similar structure.
Current View
The current structure suggests that even if the market opens with a gap-up, it may not sustain.
If the initial market declines and consolidates around the 78% Fibonacci level, then we can expect the correction to continue.
On the other hand, if the decline sees a solid pullback around 24,968, then we can expect a minimum pullback of 38% to 61% in the minor swing.
Alternate View
Structurally, the probability of a rally continuation is low,
which means we won’t get a bullish signal unless the price breaks above the 78%,level.
If it does break, we can expect a rally, though some rejections may occur along the way.

Nifty lost gains but it is a positive sign to close above 25KNifty in the Euphoria of ceasefire between Iran and Israel gained a lot of ground early in the day and made a high of 25317 but could not sustain the levels and lost massive 273 points due to profit booking to close the day at 25044. Although the loss was big but the silver lining is Nifty still ended the day 72 points in the green and closed above 25K levels. As there were news and claims related to ceasefire violations from both sides a lot of investors and participants were apprehensive of carrying long positions forward. If the things remain positive over night and if important resistance levels of 25116 and 25251 are crossed we might yet again see positive momentum building.
Nifty Resistances remain at: 25116, 25251, 25317. Closing above 25317 will lead to further upside towards the next resistance levels of 25491 and 25660.
Nifty Supports remain at: 25499 (Trend line support), 24713, 24521 (Mother Line Support) and 24463. closing below 24463 can had over the gains to the Bears who can drag index down towards Father line support of 23861.
Disclaimer: The above information is provided for educational purpose, analysis and paper trading only. Please don't treat this as a buy or sell recommendation for the stock or index. The Techno-Funda analysis is based on data that is more than 3 months old. Supports and Resistances are determined by historic past peaks and Valley in the chart. Many other indicators and patterns like EMA, RSI, MACD, Volumes, Fibonacci, parallel channel etc. use historic data which is 3 months or older cyclical points. There is no guarantee they will work in future as markets are highly volatile and swings in prices are also due to macro and micro factors based on actions taken by the company as well as region and global events. Equity investment is subject to risks. I or my clients or family members might have positions in the stocks that we mention in our educational posts. We will not be responsible for any Profit or loss that may occur due to any financial decision taken based on any data provided in this message. Do consult your investment advisor before taking any financial decisions. Stop losses should be an important part of any investment in equity.

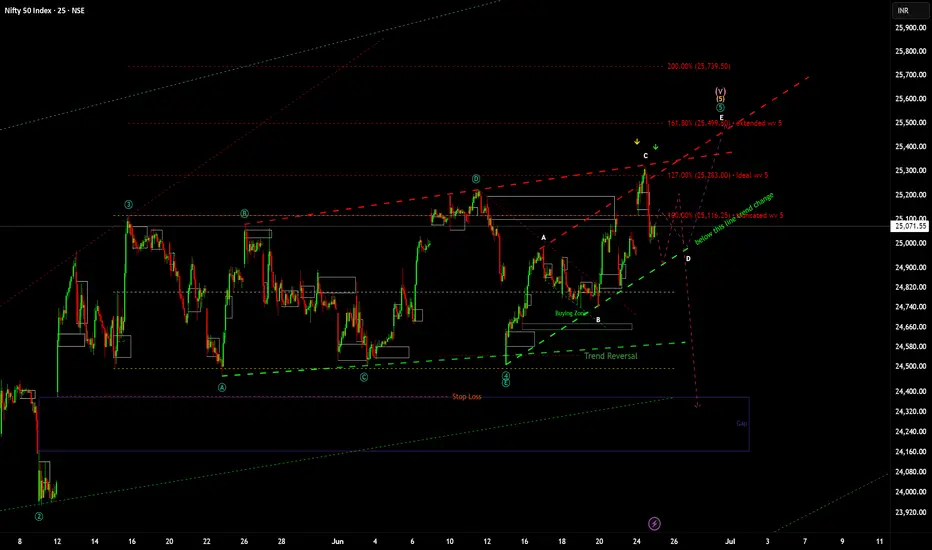
NIfty my view and not a sell or buy recommendation....nifty : My view for coming days. hope it takes the violet line.🤞🏻
technically it has completed Wv 5 which is 127% but the structure is not clear so can go into extension which may take it to 161%. green line if it is broken on daily Tf we are entering correction.🤞🏻.
Nifty levels - Jun 25, 2025Nifty support and resistance levels are valuable tools for making informed trading decisions, specifically when combined with the analysis of 5-minute timeframe candlesticks and VWAP. By closely monitoring these levels and observing the price movements within this timeframe, traders can enhance the accuracy of their entry and exit points. It is important to bear in mind that support and resistance levels are not fixed, and they can change over time as market conditions evolve.
The dashed lines on the chart indicate the reaction levels, serving as additional points of significance to consider. Furthermore, take note of the response at the levels of the High, Low, and Close values from the day prior.
We hope you find this information beneficial in your trading endeavors.
* If you found the idea appealing, kindly tap the Boost icon located below the chart. We encourage you to share your thoughts and comments regarding it.
Wishing you success in your trading activities!
Diametric Pattern - Riding the current G-wave- Riding the G-wave - hoping it to tend to be nearly equal to A-wave
- 90* Gann acting as resistance
- 270* Gann as supports

NIFTY at Best Resistance !!This is the 1 hour Chart of NIFTY 50.
NIFTY 50 is trading near it's Resistance zone at 24400 range.
NIFTY 50 is forming a broadening pattern; resistance lies near 24,500.
Nifty 50 is forming parallel channel inside the pattern ; resistance lies near 24350.
If this level is sustain, then we may see Lower prices in Nifty 50.
Thank You !!

# Niftydirections and levels for June 24:Good morning, Friends! 🌞
Here are the market directions and levels for June 24:
Market Overview
Due to ongoing global issues, the markets are showing high volatility. Structurally, both the global and our local markets are still moving within a range.
However, Gift Nifty is indicating a strong gap-up of around 250 points.
So, what can we expect today?
In the previous session, both Nifty and Bank Nifty witnessed sharp ups and downs. Even with those swings, they still ended within a range.
However, today’s gap-up might break that previous range—if it holds.
We should wait for clear confirmation before expecting any continuation.
That means, if the market breaks the resistance with a solid candle or consolidates around the resistance zone, we can expect the rally to continue.
On the other hand, if the market faces rejection at the resistance, it may re-enter the range and move back within the channel.
Let’s look at the chart for more clarity.
Both Nifty and Bank Nifty appear to be showing a similar structure.
Current View
As already discussed:
If the market breaks out or consolidates around the rejection zone, we can expect a further rally continuation towards a minimum of the 78% Fibonacci level — for Bank Nifty and for Nifty, around the 25,286 to 25,383 zone.
On the other hand, if the market faces rejection and breaks the 38% Fibonacci level of the minor swing:
Then we can expect a minimum correction of 50% to 78% in that minor swing.( to use fib
Nifty: Low to High – 24,864 to the upcoming high)
Alternate View
If the gap-up doesn’t sustain and the market breaks the 38% Fibonacci level of the minor swing:
Then again, we can expect a correction of at least 50% to 78% in the same swing..( to use fib
Nifty: Low to High – 24,864 to the upcoming high)

#NIFTY Intraday Support and Resistance Levels - 24/06/2025Today, Nifty is expected to open with a gap-up near the 25,250 level. This level is crucial, as a sustained move above it can trigger a strong upside rally. If Nifty manages to hold above 25,250, we may see targets of 25,350, 25,400, and even 25,450+ in the coming sessions. On the downside, if the index slips below 24,950, it could lead to a corrective move toward 24,850, 24,800, and potentially 24,750 zones.
Traders should closely watch the 25,050–25,100 range for intraday strength, and the 24,950 mark as immediate support. Any breakout or breakdown from these levels will offer direction for the day. Maintain strict stop-loss and consider trailing profits as levels get tested.

24 June nifty breakout & breakdown levels 🔺 Bullish (Call Option / CE) Strategy:
✅ Buy CE (Call Option) when:
Above 24,710 → Entry for bullish trade
"Above 10m hold CE by buy level"
Above 24,870 → Stronger confirmation
"Above Opening S1 10M Hold CE By level"
Above 25,020 → Positive trade view
"Above 10M hold positive trade view"
Above 25,130 → Safer CE entry zone
"Above 10M hold CE by entry level"
Above 25,233 → Closing shot level
"Above 10M Closing Shot cover level"
🔻 Bearish (Put Option / PE) Strategy:
✅ Buy PE (Put Option) when:
Below 24,710 → Entry for bearish trade
"Below 10m hold PE By level"
Below 24,870 → Bearish confirmation
"Below Opening R1 10M Hold PE By level"
Below 25,020 → Negative trade view
"Below 10M hold nigeative trade view"
Below 25,130 → Risky PE zone
"Below 10M hold PE By Risky Zone"
Below 25,233 → Safer PE Zone
"Below 10M hold PE By Safe Zone"

Nifty Analysis EOD – June 23, 2025 – Monday🟢 Nifty Analysis EOD – June 23, 2025 – Monday 🔴
👊 Tug of War Between Optimism and Pessimism
Nifty opened with a sharp 140-point gap-down, weighed by geopolitical tensions and negative news cues. The mood was clearly pessimistic — yet, from the deep low of 24,824.85, bulls made a bold comeback.
What followed was a classic textbook reversal:Price clawed back up, cutting through multiple key resistances — S1, VWAP, CDH, CPR BC, and Central CPR — before kissing the CPR TC, where it marked the day high at 25,057. This level acted as a supply zone and pushed Nifty back down toward the CPR BC, where it managed to close above the open — a quiet victory for the bulls, even in a red session overall.
The level 24,825 has now proven itself once again — the market’s respect for this support zone grows stronger with every bounce.
Today’s candle was a spinning top-style doji and also formed an inside bar, with all movement inside Friday’s wide-range candle (352 pts). Despite a smaller 232-point range today, this still requires caution — inside bars after large-range candles often result in false breakouts, especially amid macro noise.
📌 When the world looks bearish, and the chart looks bullish — trust your system.And that’s exactly what I did today — sticking to the Gladiator Strategy, a simple, disciplined intraday price action-based option buying framework.
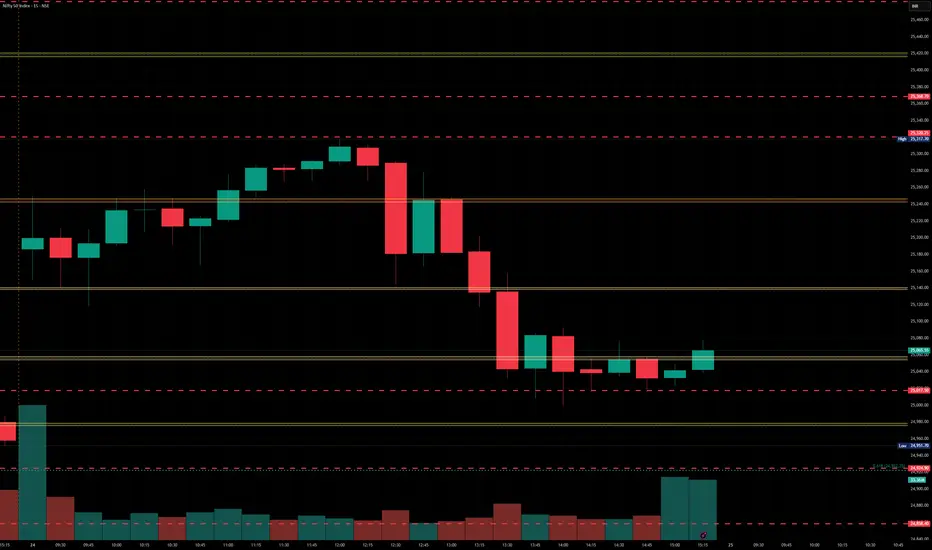
🕯 5 Min Time Frame Chart with Intraday Levels
🕯 Daily Time Frame Chart with Intraday Levels
🕯 Daily Candle Breakdown
Open: 24,939.75
High: 25,057.00
Low: 24,824.85
Close: 24,971.90
Change: −140.50 (−0.56%)
📊 Candle Structure Breakdown
Real Body: 32.15 pts (small green body)
Upper Wick: 85.10 pts
Lower Wick: 114.90 pts
🔍 Interpretation
Despite a lower close than Friday, it was a green-bodied candle (close > open).
Long lower wick shows strong buying near 24,825.
Long upper wick signals resistance near 25,050–25,060.
🕯 Candle Type
📍 Spinning Top with Long Wicks — Sign of indecision, but slight bullish bias due to buying off the lows.
📌 Key Insight
Support at 24,825 holds strong.
Upper rejection near 25,050 indicates tight overhead pressure.
Watch closely:
Break above 25,060 → May trigger bullish continuation.
Break below 24,820 → Could open downside to 24,735–24,660 zone.
🛡 5 Min Intraday Chart
⚔️ Gladiator Strategy Update
ATR: 254.95
IB Range: 163.25 → Medium IB
Market Structure: ⚖️ Balanced
Trades Triggered:
🟢 10:14 AM – Long Trade → ✅ Target Achieved (Trailing Exit, R:R 1:4.51)
🔴 2:16 PM – Short Signal → ❌ Discarded (RR not favorable)
📌 Support & Resistance Zones
Resistance Levels
24,980 ~ 25,000
25,060 ~ 25,080
25,125 ~ 25,150
25,180 ~ 25,212
25,285
Support Levels
24,965
24,894 ~ 24,882
24,825
24,800 ~ 24,768
24,735 ~ 24,725
💭 Final Thoughts
Markets are currently walking a tightrope — with bearish headlines on one side and bullish price action on the other.The Gladiator approach today helped sidestep the noise and focus on what matters: price structure and clean levels.
📌 Trade the chart, not the news. And when in doubt — zoom out.
🧠 “Uncertainty is the playground of the disciplined.”
✏️ Disclaimer
This is just my personal viewpoint. Always consult your financial advisor before taking any action.

Nifty levels - Jun 24, 2025Nifty support and resistance levels are valuable tools for making informed trading decisions, specifically when combined with the analysis of 5-minute timeframe candlesticks and VWAP. By closely monitoring these levels and observing the price movements within this timeframe, traders can enhance the accuracy of their entry and exit points. It is important to bear in mind that support and resistance levels are not fixed, and they can change over time as market conditions evolve.
The dashed lines on the chart indicate the reaction levels, serving as additional points of significance to consider. Furthermore, take note of the response at the levels of the High, Low, and Close values from the day prior.
We hope you find this information beneficial in your trading endeavors.
* If you found the idea appealing, kindly tap the Boost icon located below the chart. We encourage you to share your thoughts and comments regarding it.
Wishing you success in your trading activities!

Nifty directions and levels for June 23Good morning, Friends! 🌞
Here are the market directions and levels for June 23:
Market Overview
The global market is showing signs of consolidation with some cautious sentiment, and our local market is also reflecting the same.
However, Gift Nifty is indicating a 130-point negative start.
So, what can we expect today?
The structures in the higher degree timeframes are slightly different from one another, so we can't take any firm decision in advance.
However, my expectation is that the market may close with a negative bias today.
Let’s look at the chart for more clarity.
On the 15-minute chart, both Nifty and Bank Nifty appear to be showing a similar structure.
Current View
The current view suggests that if the market sustains the initial gap-down and consolidates, we can expect the correction to continue.
In this case, even if there is a solid pullback, the market may not move much higher.
This would mean it could consolidate between the previous day’s high and the upcoming low.
Alternate View
The alternate view suggests that if the market takes a pullback initially, it may consolidate within the previous day's range.
If it breaks the previous high after that, we can expect further rally continuation, possibly in a diagonal pattern.

#NIFTY Intraday Support and Resistance Levels - 23/06/2025A flat opening is expected in Nifty today. If Nifty sustains above the 25,050–25,100 zone after the open, we can expect an upside rally toward 25,150 → 25,200 → 25,250+ levels. This bullish momentum may continue if Nifty remains strong above 25,100.
However, any downside momentum may begin if Nifty starts trading below 24,950, which is a crucial support zone. In such a scenario, the index could slip toward 24,850 → 24,800 → 24,750- levels.
For intraday trades, focus on breakout or breakdown levels, and manage risk with trailing stop-losses in place.

Nifty50 June 2025 LevelNifty50 now chart tomorrow open down side and going up for breakout next swing.

NIFTY MAY HIT 25800 in JUNE 2025I am posting this just to record my analysis. I am using some logics to analyze and forecast moves. You may find it interesting that yes with true logic and observation on data pattern and chart pattern, yes it possible to forecast at some extend.
May be I will be wrong but it's all about probability, it's in 28% probability of winning but with a high reward.
Don't take any trade or financial action based on this. It's just a post of idea and knowledge sharing.
Thanks for reading.
Bye.

