#NIFTY Intraday Support and Resistance Levels - 18/06/2025Today, Nifty is expected to open with a slight gap down near the 24,850 zone, indicating caution among participants at higher levels.
🔼 If Nifty sustains above the 24,750–24,800 zone, a positive move may unfold with upside targets at 24,850 → 24,900 → 24,950+. Sustained strength above 24,950 could lead to a further rally.
🔁 On the other hand, if Nifty approaches the 24,950–24,900 zone and shows signs of rejection, it could lead to a reversal. In that case, the downside targets may be 24,850 → 24,800 → 24,750-.
🔽 A decisive move below the 24,700 level would indicate bearish control, opening further downside towards 24,650 → 24,600 → 24,550-.
NIFTY trade ideas

18 june Nifty50 brekout and Breakdown leval
CALL (CE) – Bullish triggers
↑ 24,437 – 24,547 : Safe‑zone long entry
↑ 24,672: Hold CE while above this mark
↑ 24,780 : Opening‑S1 breakout, keep holding CE
↑ 24,930.00 : Turns bias positive; fresh CE can be added
↑ 25,083.00 : Entry level for aggressive longs
↑ 25,318.00 : Short‑cover zone; strong upside momentum possible
PUT (PE) – Bearish triggers
↓ 25,318.00 : If price closes back under, shift to PE (safe)
↓ 25,083 : PE in the “risky” reversal zone
↓ 24,930 : Bias flips negative; keep/add PE
↓ 24,780 : Opening‑R1 break; hold PE
↓ 24,672 : Continue PE below this level
↓ 24,535 : Unwinding zone – watch for fast drops
↓ 24,437 : Final downside support; trail PEs here

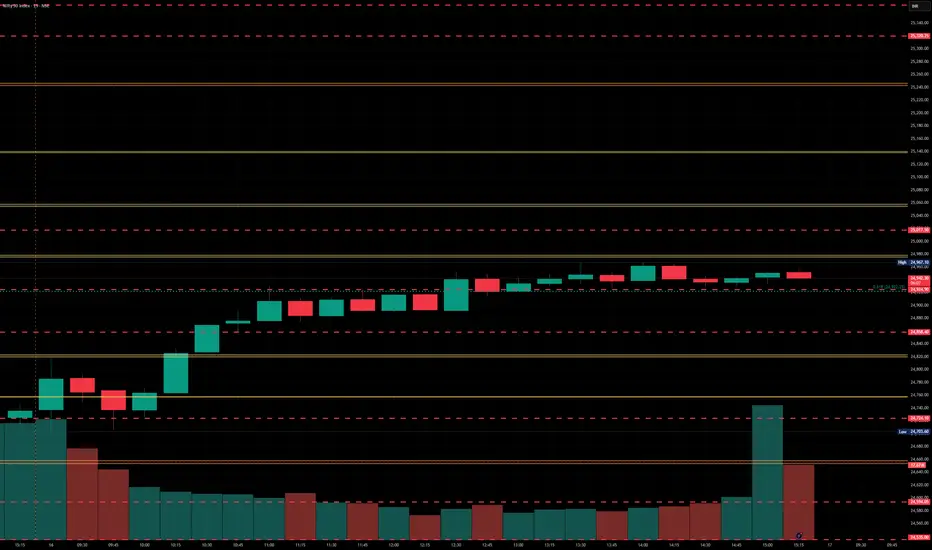
Nifty Analysis EOD – June 17, 2025 – Tuesday🟢 Nifty Analysis EOD – June 17, 2025 – Tuesday 🔴
⚠️ Resistance Rejection at 25K – Pause or Warning Sign?
Yesterday’s note rightly anticipated today’s challenge near 25K — and that’s exactly how the session unfolded.
Nifty opened at 24,977.85, right inside the critical resistance zone of 24,972–25,000, and formed a near O=H (Open = High) structure. The index quickly lost ground, dropping 135 points within the first hour to mark a day low of 24,813.70, forming a medium-sized Initial Balance (IB) within a wide CPR — conditions known for range-bound or tricky days.
Throughout the session, Nifty hovered largely inside the CPR and IB, with a false breakdown attempt around 12:50 PM. Such setups (wide CPR + higher value + medium IB) often result in false moves or low-conviction sessions, and today was no exception.
By day’s end, Nifty closed at 24,853.40, logging a modest −93.10 point dip, forming what can be termed as a healthy pullback — but the real test remains.
If bulls want to take charge again, they must breach and close above 25,025. On the flip side, if 24,800–24,820 gives way, it could trigger a slide toward 24,725 and 24,660 in the coming sessions.
🕯 Daily Time Frame Chart
🕯 Daily Candle Breakdown
Open: 24,977.85
High: 24,982.05
Low: 24,813.70
Close: 24,853.40
Change: −93.10 (−0.37%)
📊 Candle Structure Breakdown
Real Body: 124.45 pts → 🔻 Red Candle
Upper Wick: 4.20 pts
Lower Wick: 39.70 pts
🔍 Interpretation
Opened near the day’s high but selling dominated soon after.
Small upper wick shows minimal buyer strength; recovery attempts were mild.
Lower wick indicates some support emerged at day’s low, but overall tone remained bearish.
🕯 Candle Type
🟥 Bearish Candle – strong real body, minor lower wick — reflects steady intraday selling, though not overly aggressive.
📌 Key Insight
Nifty has now rejected the 25K zone two days in a row, turning it into short-term resistance.
If 24,800 breaks, expect pressure to mount — next watch: 24,725 → 24,660.
Bulls need a close above 25,025 to regain command.
🛡 5 Min Intraday Chart
⚔️ Gladiator Strategy Update
ATR: 258.48
IB Range: 131.60 → Medium IB
Market Structure: ⚖️ Balanced
Trades:🚫 No Trade Triggered by System
📌 Support & Resistance Zones
Resistance Levels
24,894 ~ 24,882
24,972 ~ 25,000
25,060 ~ 25,080
25,102 ~ 25,125
Support Levels
24,825 ~ 24,847
24,725 ~ 24,735
24,660
24,590
💭 Final Thoughts
Today’s session didn’t break anything major — but it also didn’t conquer anything new.Stuck between major support and resistance, the index is coiling for a move. Bulls have the burden of proof now.
🧠 “Markets don’t pause forever — compression leads to expansion. Be ready when it chooses its direction.”
✏️ Disclaimer
This is just my personal viewpoint. Always consult your financial advisor before taking any action.

Resistance zones and Geo-political instability acting up.Geo-Political instability and resistance zone are acting up together to stop Nifty and not allowing it to close above 25K. As the world is looking at developments in Iran Vs Israel conflict with beated heart market today gave up some gains from yesterday. The only index looking strong is IT index right now. Avoid taking very long positions unless you are very sure of the company. Yesterday also Nifty failed to close above 25K opened briefly near 25K today and then moved downwards. Lot will be decided in the short term by the developments that happen tonight. Important G7 meet and US Federal reserve Rate Cut meet is also to happen later in the week. These 2 global factors will decide fate of the market in the short term. Local factors are all in line and nothing to worry for Indian markets on that front.
The supports for Nifty remain at: 24713 (Trend line support), 24425 (Mother line support of Daily chart), next support is near 23917, 23806 (Father line support of daily chart is in place). Closing below 23906 can lead to further down side and in such a scenario Nifty can fall further towards 23500 or 23047 levels. If we get a closing below that we will give updates regarding the same.
Resistances for Nifty remain at: 24982 (Today's high), 25112 and trend line resistance of 25251. When we get a closing above 25251 we will update you regarding the further upward resistnace levels.
Disclaimer: The above information is provided for educational purpose, analysis and paper trading only. Please don't treat this as a buy or sell recommendation for the stock or index. The Techno-Funda analysis is based on data that is more than 3 months old. Supports and Resistances are determined by historic past peaks and Valley in the chart. Many other indicators and patterns like EMA, RSI, MACD, Volumes, Fibonacci, parallel channel etc. use historic data which is 3 months or older cyclical points. There is no guarantee they will work in future as markets are highly volatile and swings in prices are also due to macro and micro factors based on actions taken by the company as well as region and global events. Equity investment is subject to risks. I or my clients or family members might have positions in the stocks that we mention in our educational posts. We will not be responsible for any Profit or loss that may occur due to any financial decision taken based on any data provided in this message. Do consult your investment advisor before taking any financial decisions. Stop losses should be an important part of any investment in equity.

Nifty levels - Jun 18, 2025Nifty support and resistance levels are valuable tools for making informed trading decisions, specifically when combined with the analysis of 5-minute timeframe candlesticks and VWAP. By closely monitoring these levels and observing the price movements within this timeframe, traders can enhance the accuracy of their entry and exit points. It is important to bear in mind that support and resistance levels are not fixed, and they can change over time as market conditions evolve.
The dashed lines on the chart indicate the reaction levels, serving as additional points of significance to consider. Furthermore, take note of the response at the levels of the High, Low, and Close values from the day prior.
We hope you find this information beneficial in your trading endeavors.
* If you found the idea appealing, kindly tap the Boost icon located below the chart. We encourage you to share your thoughts and comments regarding it.
Wishing you success in your trading activities!

Daily SMC Post-Market Analysis – Nifty 50 | 16 June 2025🔍 Daily Chart – Smart Money Concepts (SMC) Analysis
Instrument: Nifty 50 Spot Index
Date Analyzed: 16 June 2025 (Monday)
Timeframe: 1D (Daily) – Higher Timeframe Structure
📈 Daily Price Summary
🟢 Open: 24,732
🔼 High: 24,967
🔽 Low: 24,703
🔴 Close: 24,946
Price closed strongly near the high of the day, pushing deeper into the Bearish FVG1 zone, indicating potential premium exhaustion in HTF.
🔹 HTF Market Structure (Daily Chart)
🔼 Last HH / Break of Structure (BoS): 25,222
🔽 Last HL / Change of Character (CHoCH): 24,502
🔁 Previous LH (BoS): 25,079
🔁 Previous HH (BoS): 25,116
📌 Trend Bias: Still Bullish, as long as price holds above the Higher Low (24,502)
📍 Caution: Price is inside bearish premium zones and reacting to internal resistance
💰 Premium / Discount Zoning (Swing-Based)
🟢 Swing Low: 24,502
⚖️ Swing Mid: 24,862
🔺 Swing High: 25,222
📍 Current Close (24,946) = In Premium Zone → Watch for liquidity sweep or reversal setups.
🟩 Bullish Order Block (HTF)
Zone: 24,150 – 24,447
Volume Multiplier: 1.1
🔍 This OB sits in deep discount, and marked with institutional interest. If price returns here, it could offer high-probability long setups.
🔻 Bearish Fair Value Gaps (FVG)
24,754 – 25,081 ✅ Currently active
25,143 – 25,230 🔺 Awaiting reaction
25,485 – 25,739 🔺 Future resistance zone
🟢 Bullish Fair Value Gaps (FVG)
24,644 – 24,971 ✅ Price traded inside this today
24,164 – 24,547 ✅ Deep support zone aligning with OB
📌 Summary Outlook:
HTF (Daily) remains bullish but price has entered premium and bearish FVGs, approaching resistance.
Price must break and close above 25,222 to confirm a fresh bullish leg.
A breakdown below 24,502 (HL) would be the first sign of structure shift, invalidating the bullish setup.
Key levels for reaction:
Upside Breakout Zone: 25,230+
Downside Watch Zone: 24,447–24,150 (Bullish OB with volume)

#NIFTY Intraday Support and Resistance Levels - 17/06/2025Today, a flat opening is expected in Nifty near the 24,950 level. The index has been moving in a narrow consolidation zone and currently trades just below an important resistance. If Nifty manages to sustain above the 25,050–25,100 zone after the opening, we may witness bullish momentum building up. This could lead to an upward move toward 25,150, 25,200, and possibly 25,250+ levels during the day.
However, if Nifty fails to hold above the 24,950 mark and slips into weakness, it may invite intraday profit booking. A drop below the 24,900–24,950 level could open the downside toward 24,850, 24,800, and 24,750 levels. This zone has previously acted as a support range, and any break here could intensify selling pressure.

$DXY weakness and EM markets: $NIFTY more upside? The recent weakness in TVC:DXY is well documented. We have analyzed it here in detail in our blogs. This weakness is giving wings to all kinds of risk assets including Ems. One of our favorite EM in this space has been India and NSE:NIFTY index for quiet some time. It is the only EM which is close to beating S&P 500 over the last 5-year period. We have been recently bullish at NSE:NIFTY and published new targets on June 6. Please check the post in the link here.
NSE:NIFTY : New highs incoming; 27500 can be cycle highs for NSE:NIFTY by RabishankarBiswal — TradingView
The road to the medium-term target of 27500 on NSE:NIFTY has to do with the weakness of $DXY. As we see, lower lows and lower highs in the Dollar index TVC:DXY provides the required boost to risky assets like Stocks, Crypto and EMs. Even if we have some recent choppiness in the market the upward momentum will continue. By the end of July, we might see TVC:DXY at 96 up 2.5% and NSE:NIFTY @ 26000 up 5%.
Verdict : Pair Trade : Short TVC:DXY to 96 and Long NSE:NIFTY to 26000.

Solid V Shaped recovery within the Parallel channel for NiftyNifty recovered sharply within the parallel channel. The reasons that can be attributed are inherent strength in the Indian market and swift recovery in IT, Infra, Metal, commodities, Realty, Mid and Small cap browsers. The closing of Nifty was at 24946 which is just above the mother line which is at 24908. The same mother line provided the support to Nifty in the last few hours of trade when there was some intraday profit booking pressure.
Nifty Supports remain at: 24908 (Mother line Support), 24836, 24690 (Father Line Support), 24555 (Channel Bottom Support) and 24480 recent low. Below 24880 Nifty will be very weak and Bears in that scenario can drag Nifty further down to 24195 or 23957. These are the levels as of now. If we go below these levels in unlikely circumstances we will update the levels once we get there.
Nifty Resistances remain at: 24973, 25106 (Mid Channel Resistance) and 25231.Once we close above 25231 we will update further levels.
Disclaimer: The above information is provided for educational purpose, analysis and paper trading only. Please don't treat this as a buy or sell recommendation for the stock or index. The Techno-Funda analysis is based on data that is more than 3 months old. Supports and Resistances are determined by historic past peaks and Valley in the chart. Many other indicators and patterns like EMA, RSI, MACD, Volumes, Fibonacci, parallel channel etc. use historic data which is 3 months or older cyclical points. There is no guarantee they will work in future as markets are highly volatile and swings in prices are also due to macro and micro factors based on actions taken by the company as well as region and global events. Equity investment is subject to risks. I or my clients or family members might have positions in the stocks that we mention in our educational posts. We will not be responsible for any Profit or loss that may occur due to any financial decision taken based on any data provided in this message. Do consult your investment advisor before taking any financial decisions. Stop losses should be an important part of any investment in equity.

Nifty Analysis EOD – June 16, 2025 – Monday🟢 Nifty Analysis EOD – June 16, 2025 – Monday 🔴
📈 Expected Follow-Through Plays Out – Bulls Eye 25K Hurdle Next
Nifty opened flat-to-positive at 24,737, briefly dipped to the day’s low of 24,703.60, and then reversed smartly to touch an intraday high of 24,967.10 by 13:40. After that, the index spent the rest of the day consolidating in a narrow 40-point band and closed at 24,940.95 intraday (adjusted close: 24,946.50), delivering a solid +227.90 point gain.
As anticipated, the 24,768–24,800 support zone provided the launchpad for further upside, confirming the bullish follow-up from Friday's recovery. The rally tested 24,967, just shy of the crucial resistance at 24,972, which remains a key watch for the next session.
🔍 However, going forward, the bulls face major challenges around 25,000–25,080. This zone has acted as a hurdle in the past and could either stall the rally or serve as a breakout trigger. Watch price behavior carefully around these levels to assess conviction.
🛡 5 Min Chart with Levels
🕯 Daily Time Frame Chart
🕯 Daily Candle Breakdown
Open: 24,732.35
High: 24,967.10
Low: 24,703.60
Close: 24,946.50
Change: +227.90 (+0.92%)
📊 Candle Structure Breakdown
Real Body: 214.15 pts → 🟢 Strong Green Candle
Upper Wick: 20.60 pts
Lower Wick: 28.75 pts
🔍 Interpretation
Opened near day’s low, closed near day’s high — classic bullish sentiment.
Small wicks show controlled buying with minimal resistance and shakeouts.
Reinforces the bulls’ momentum after Friday’s OL recovery candle.
🔦 Candle Type
💚 Bullish Marubozu–type / Bullish Continuation Candle– Often found during the middle leg of a bullish swing, signaling strong trend momentum.
📌 Key Insight
Today's price action confirmed continuation of the recovery.
Close above 24,950–25,000 in the next session could ignite fresh upside.
Rejection around 25,060–25,080 would indicate caution — stay nimble.
🛡 5 Min Intraday Chart
⚔️ Gladiator Strategy Update
ATR: 268.49
IB Range: 114.05 → Medium IB
Market Structure: ⚖️ Unbalanced
Trades:
✅ 10:20 AM – Long Triggered → Target Achieved, Trailing SL Hit (RR: 1:3.28)
📌 Support & Resistance Zones
Resistance Levels
24,972 ~ 25,000
25,060 ~ 25,080
25,102 ~ 25,125
Support Levels
24,894 ~ 24,882
24,825 ~ 24,847
24,725 ~ 24,735
24,660
💭 Final Thoughts
The market played exactly as mapped — now it’s about decision time near 25K. Will the bulls charge ahead or pause? Either way, the structure favors short-term bullishness — but profit booking pressure near resistance must be expected.
🧠 “Momentum is a gift – but without volume and conviction, it fades at resistance.”
✏️ Disclaimer
This is just my personal viewpoint. Always consult your financial advisor before taking any action.

Nifty levels - Jun 17, 2025Nifty support and resistance levels are valuable tools for making informed trading decisions, specifically when combined with the analysis of 5-minute timeframe candlesticks and VWAP. By closely monitoring these levels and observing the price movements within this timeframe, traders can enhance the accuracy of their entry and exit points. It is important to bear in mind that support and resistance levels are not fixed, and they can change over time as market conditions evolve.
The dashed lines on the chart indicate the reaction levels, serving as additional points of significance to consider. Furthermore, take note of the response at the levels of the High, Low, and Close values from the day prior.
We hope you find this information beneficial in your trading endeavors.
* If you found the idea appealing, kindly tap the Boost icon located below the chart. We encourage you to share your thoughts and comments regarding it.
Wishing you success in your trading activities!
Nifty : Bounced back from the support and survived a Sell SignalNifty : Bounced back from the support and survived a Sell Signal as displayed in the chart
( Not a Buy / Sell Recommendation
Do your own due diligence ,Market is subject to risks, This is my own view and for learning only .)

Nifty 50 at a Turning Point? Key Levels & Market Outlook AheadThe Nifty 50 ended the week at 24,718.60 with a rejection of (-1.14%)
If Nifty sustains below 24,641, selling pressure may increase. However, a move above 24,798 could restore bullish momentum.
Key Levels for the Upcoming Week
🔹 Price Action Pivot Zone:
The crucial range to watch for potential trend reversals or continuation is 24,641 -24,798.
🔹 Support & Resistance Levels:
Support:
S1: 24,407
S2: 24,094
S3: 23,570
Resistance:
R1: 25,035
R2: 25,352
R3: 25,888
Market Outlook
✅ Bullish Scenario: A sustained breakout above 24,791 could attract buying momentum, driving Nifty towards R1 (25,035) and beyond.
❌ Bearish Scenario: A drop below 24,641 may trigger selling pressure, pushing Nifty towards S1 (24,407) or lower.
Disclaimer: lnkd.in

#NIFTY Intraday Support and Resistance Levels - 16/06/2025Today, a slightly gap-up opening is expected in Nifty near the 24,735 level. If Nifty sustains above the 24,750–24,800 zone after the opening, it may lead to a continuation of the upside move toward 24,850, 24,900, and potentially 24,950+ during the day. This zone can attract intraday buying interest, especially if supported by volume and momentum.
However, any rally approaching the 24,950 level should be watched cautiously, as it may act as a reversal zone, triggering profit booking or intraday resistance.
On the other hand, if Nifty fails to hold 24,700 levels and starts drifting lower, fresh selling pressure could emerge, pushing the index toward 24,650, 24,600, and even 24,550 during the session.

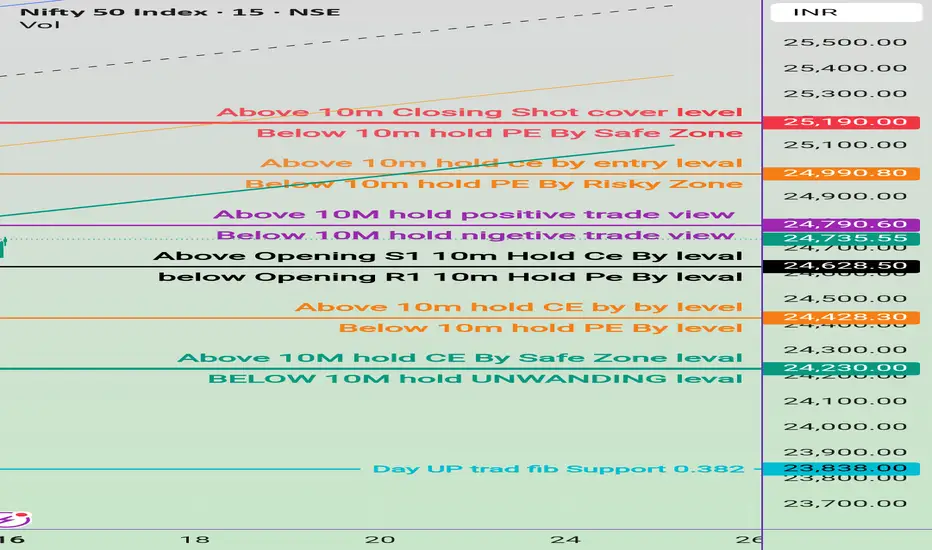
16 june Nifty50 brekout and Breakdown leval
🔺 Resistances / CE (Call) Holding Zones:
25,190.00 – 🔴 Above 10m Closing Shot Cover Level
24,990.80 – 🟠 Above 10m Hold CE by Entry Level
24,790.60 – 🟣 Above 10M Hold Positive Trade View
24,628.50 – ⚫ Above Opening S1 10m Hold CE by Level
24,428.30 – 🟠 Above 10m Hold CE by Level
24,230.00 – 🟢 Above 10M Hold CE by Safe Zone Level
🔻 Supports / PE (Put) Holding Zones:
Below 25,190.00 – Below 10m Hold PE by Safe Zone
Below 24,990.80 – Below 10m Hold PE by Risky Zone
Below 24,790.60 – Below 10M Hold Negative Trade View
Below 24,628.50 – Below Opening R1 10m Hold PE by Level
Below 24,428.30 – Below 10m Hold PE by Level
Below 24,230.00 – Below 10M Hold Unwinding Level

Nifty Daily SMC Analysis – 13 June 2025 (Friday Close)📊 Nifty Daily SMC Analysis – 13 June 2025 (Friday Close)
🕯️ Daily Candle: Bullish
• Open: 24473
• High: 24754
• Low: 24473
• Close: 24718
🧠 Market Structure (5-Candle Fractals – Daily Chart)
• Last HL / CHoCH: 24502
• Last HH / BoS: 25222
✔️ Structure is still bullish: HL → HH
✔️ Price respected previous HL; bullish continuation possible
📦 Key Smart Money Zones (Daily)
✅ 1st Bullish Order Block (OB): 24150 – 24447
✅ Bullish FVG #1: 24164 – 24547
✅ Bullish FVG #2: 24644 – 24671
✅ Volume Filter Confirmed OB
• Volume > 1.1× average
• MA Period: 21
🧭 Price Context
✅ Closed as a green candle inside the Discount Zone
✅ Price rejected OB low (24447) and FVG midpoint
✅ Strong demand confluence between 24150 – 24550
🧨 Investment Strategy: Long Bias / Bullish
🎯 Trade Bias: Mildly bullish as long as 24502 (HL) holds
🛑 Invalidation: Daily close below 24150 OB low
📈 Target: Retest or break 25222 (HH)
🔍 Look for bullish confirmation on lower timeframes (15m–1h) inside OB/FVG zones
⚠️ Stay alert for liquidity sweep below 24500 as potential inducement
🔔 Summary
Nifty continues to trade within a bullish SMC structure. With price closing inside a discount zone, reacting from a validated Bullish OB and multiple FVGs, there are signs of smart money accumulation.
📌 As long as 24502 holds, expect bullish continuation toward 25222.
📉 Structure turns neutral to bearish only if 24150 is broken on a daily close.

NIfty SpotVery good resilience shown by Indian Markets amid Global uncertainty.
Iran - Israel war will surely have an impact on opening of the markets tomorrow..
The way the war is continuing all likely hood of opening deep red...tomorrow
Well but i feel taht will be a good opportunity to buy near 24000-23850 Zone... as it is also a previous GAP so all possibility of finding suppport near that level
Have marked important level on chart.
Like... Share... Comment.

NIFTY50.....Don't loose your panic!Hello Traders,
the NIFTY50 is trading within a range of 25116 to 24462 point range. This range began on May 15th and is ongoing 'til this week!
I have labelled this move as a wave 4!
Chart analysis:
If so to come, the next move should reach targets of roughly, 25574.90! Here, a wave 5 could end, or this was all of wave 1 of 5!
If the move is a wave 1 of 5, the targets are much higher for the coming 2-3 weeks ahead!
When it was all of wave 5 the next move would be a correction to the levels of 0.5 to 0.618 of the Fibo-retracements!
In any case, the advance is not over yet, and should last for a considerable amount of time!
If the index will exceed the former ATH @ 26277 points, here the risk is ascending for an end of an impulse!
But, step by step!
Due to the conflict between Israel and Iran, I recommend to step aside and wait for calm down the dispute in the coming days! Hopefully!
This conflict has the potential to set the region on fire!
In case of an escalation of this conflict, the risk would be really hard to forecast, but I guess the potential for a formidable crash is given!
Protect your tradingaccounts with suitable products to prevent the situation from escalating (sell calls, for example)!
I don't want to hear about anyone losing their entire trading account!
Have a great week.....
Ruebennase
Please ask or comment as appropriate.
Trade on this analysis at your own risk.

Nifty Analysis EOD – June 13, 2025 – Friday 🟢 Nifty Analysis EOD – June 13, 2025 – Friday 🔴
🕊️ Gap-Down on Geopolitical Tension – Buyers Step In at Crucial Support
Nifty opened with a massive gap-down of 415 points at 24,473 triggered by overnight geopolitical tensions — testing a crucial swing low from May 22. Interestingly, the market formed an OL (Open = Low) pattern and staged a powerful 281-point intraday recovery, closing near the day’s high at 24,718.60.
While the adjusted close still reflects a −0.68% drop, the price action was dominantly bullish. The strong bounce from the 24,460–24,520 demand zone — a region that had acted as a reversal zone multiple times earlier — reaffirms its significance.
🧭 If global cues stabilize or turn positive, this could pave the way for a bounce back toward 25,000. But if Friday’s low is breached, sentiment damage may deepen further. For now, intraday opportunities are preferable over positional plays, as uncertainty persists.
📝 A reminder from the May 22 note:
“Is the retracement run finished? Technically, YES. A bold call, but unless global headwinds reappear, today’s low must sustain.”
Nifty has once again honored this level — but the coming sessions will determine whether this bounce was genuine or temporary.
🛡 5 Min Chart with Levels
🕯 Daily Time Frame Chart
🕯 Daily Candle Breakdown
Open: 24,473.00
High: 24,754.35
Low: 24,473.00
Close: 24,718.60
Net Change: −169.60 (−0.68%)
📊 Candle Structure Breakdown
Real Body: 245.60 pts → 🟢 Strong Green Candle
Upper Wick: 35.75 pts
Lower Wick: None (OL Formation)
🔍 Interpretation
Despite the gap-down, bulls took control right from the open.
The absence of a lower wick signals firm intraday confidence.
Closing near the high reinforces the buying strength, even on a net down day.
🔦 Candle Type
💚 Bullish Marubozu–like (OL) Candle– Represents a strong intra-session reversal, where buyers dominated from the very first tick.
📌 Key Insight
Price respected the 24,460–24,520 zone, once again validating it as key support.
If the next session crosses and sustains above 24,750–24,770, a short-term reversal confirmation could follow.
However, a breakdown below 24,473 may renew bearish pressure.
🛡 5 Min Intraday Chart
⚔️ Gladiator Strategy Update
ATR: 269.05
IB Range: 145.05 → Medium IB
Market Structure: Balanced
Trades:✅ 10:20 AM – Long Triggered → Target Achieved, Trailing SL Hit (RR: 1:1.7)
📌 Support & Resistance Zones
Resistance Levels
24,725 ~ 24,735
24,825 ~ 24,847 (Fibonacci 0.5 retracement level)
24,882 ~ 24,894
24,972 ~ 25,000
25,060 ~ 25,080
Support Levels
24,660
24,640 ~ 24,625
24,420
24,365 ~ 24,330
24,245 ~ 24,220
💭 Final Thoughts
Friday’s session was a battle between fear and resilience — and bulls showed up just in time. The key test ahead: can the index reclaim 25K or will the bounce fade away?
🧠 “Great rebounds are born from great fear — but follow-through is what separates noise from reversal.”
✏️ Disclaimer
This is just my personal viewpoint. Always consult your financial advisor before taking any action.

Market Recap & Outlook – Nifty and S&P 500, Bulls coming?The Indian stock market witnessed a volatile week, with the Nifty 50 closing at 24,718, down nearly 300 points from the previous week's close. The index hit a high of 25,222 and a low of 24,473, moving precisely within the range of 25,500–24,500 that I highlighted last week. I hope some of you took advantage of the cautionary signal!
Key Support Zone in Focus
The 24,400 level continues to act as a strong support—bulls have fiercely defended this zone for the past five weeks. However, if this level cracks, we could see Nifty test deeper supports at 23,900 and 23,700.
Geopolitical Overhang
The ongoing Iran-Israel tensions remain a wildcard. Unless the situation escalates significantly, I expect Nifty to trade in the 24,400–25,200 range this week.
Short-Term Strategy
I believe the current selling pressure might persist for 2–3 more sessions before the bulls regain control. Historically, Nifty tends to stay under pressure until mid-June, followed by a bullish phase leading into mid-July. If we get more dips, I’ll be looking to accumulate quality mid-cap and small-cap stocks for potential short-term gains.
S&P 500 Update
The S&P 500 closed at 5,976, down just 25 points from the previous week. The index made a high of 6,059 and a low of 5,963, forming a bearish candle on the weekly chart.
Watch These Levels
If 5,963 breaks, expect further downside towards 5,899 and 5,875. On the flip side, a sustained move above 6,030 could ignite bullish momentum, targeting resistance zones at 6,090 and 6,142.
Final Take – Bulls Gearing Up?
The broader trend still favors bulls, especially if key support levels hold. Watch for a turnaround by mid-week—"Bulls may soon reclaim the throne!"

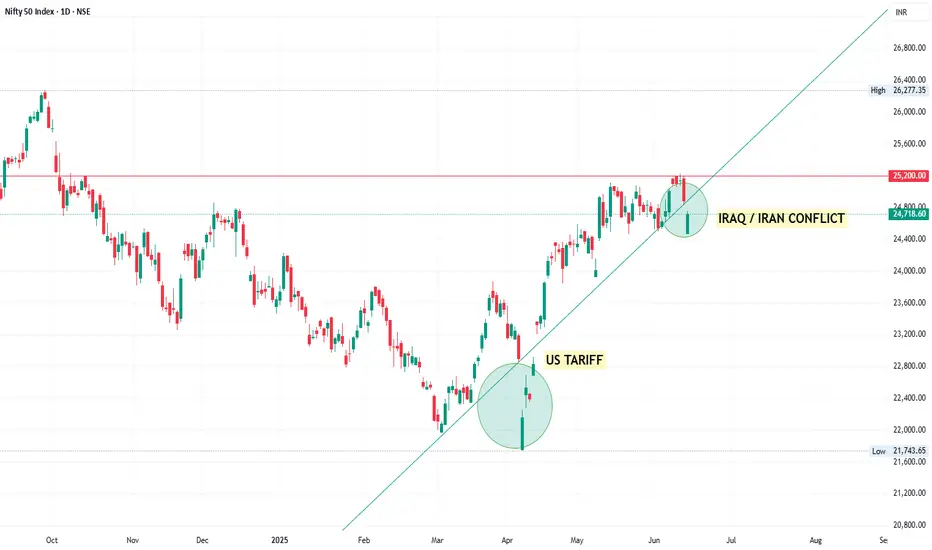
Buy on Dips is evident Uptrend Post-March 2025
The US Tariff news, though causing a temporary dip, didn’t break the trendline, indicating strong buying interest on dips.
Event-Driven Dips
US Tariff News (Early April):
Caused a sharp red candle, but was quickly bought into, forming a bullish pattern — often a sign of trend continuation.
Iraq/Iran Conflict (Early June):
Another dip occurred, briefly violating the trendline but closing with a large green candle — market resilience noted again.
Market Psychology & Sentiment
Buy-on-dips Strategy seems to dominate.
Events like tariffs or geopolitical tensions are triggering knee-jerk reactions, but institutional support is evident.
Technical Takeaways:
Trendline Support (starting from March low) remains valid; multiple touches confirm its strength.
25,200 is a key horizontal resistance; a decisive breakout above this may fuel fresh highs.
Watch for:
Break above 25,200: likely continuation toward 26,000+
Breakdown below 24,200: could test 23,600 and then 22,800
Nifty June 3rd Week Analysis Nifty is looking uncertain due to global uncertainties, and we need to track and expect moves through levels as there is no trend present on the chart right now . Upside is expected only if Nifty crosses and sustains above the 24850-950 range, and then it will face resistance at 25084. Upon crossing that, we can expect good short cover in Nifty. While if Nifty breaches 24600 on the downside, then it can slip up to levels of 24400-250.
All levels are marked in the chart posted.
