Nifty uptrend doubtI m not bullish for nifty after Friday RBI rate cuts until it crosses above 25300 level, if it takes resistance at 25255 level on Monday or Tuesday then there is high chances that this up move from 7 April and this breakout after a month long range bound nifty is nothing more than a trap of bulls. And market may break this 22000 level in upcoming 2-3 months.
NIFTY trade ideas
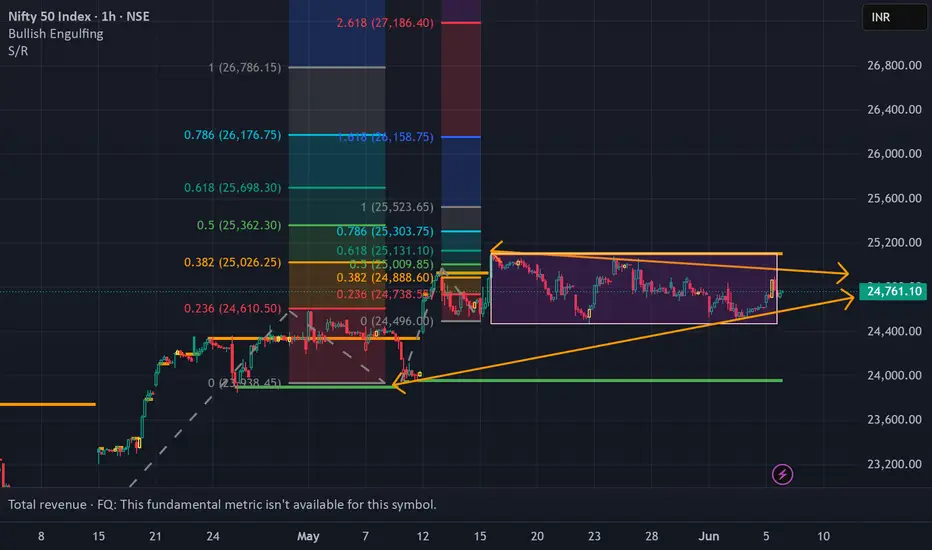
NIFTY50....Wave c of iv ended?!Hello Traders,
waves ((ii)) (magenta) probably ended @24502! There is a possibility given, that this pattern could morph into a "triangle shape". However, this would be the pattern with the most unlikely chance to be established!
Therefore, we focus on a potential a-b-c wave (iv) in green that is complete, and the next move will be to the upside.
Chart analysis!
It needs to make a new high above the waves "b" high @25079 and, at least, a new high above the waves "v" of (iii) 25116 to create a breakout signal! A possible target would be around the 25528 range.
A break to the downside below waves "c" low @ 25502 would not eliminate the triangle pattern, but chances would weaken to be one!
Anyway!
Once a trend is established, the chance of continuing is higher as to break down! So, I favor the idea of an extending wave of advance in the coming 1–2 weeks. If this happens, a new ATH will be reached! Not within the same time period but; I guess in the coming 4–6 weeks!
That's it for today.
Have a great Sunday and a great week....
Ruebennase
Please ask or comment as appropriate.
Trade on this analysis at your own risk.

ICT SMC nifty for mondayThis analysis is based on the Smart Money Concepts (SMC) introduced by ICT (Inner Circle Trader), focusing on Fair Value Gaps (FVGs) as a core element of price inefficiencies left behind by institutional order flow. The idea aims to identify potential price action setups on the Nifty index for Monday, using these concepts to anticipate high-probability areas of interest for either continuation or reversal.
Fair Value Gaps represent imbalances where price moves rapidly, leaving little to no trading in between, which often creates zones that institutions may revisit for mitigation or re-entry. This analysis highlights such zones on the higher and lower timeframes, aligning them with potential liquidity pools, order blocks, and displacement moves.
The market structure, breaker blocks, and liquidity sweeps are also taken into account to frame a precise bias—bullish or bearish—for the upcoming trading session. Key levels have been marked to help traders watch for reaction zones, and any confluences with daily or 4H imbalances are noted for added conviction.
This setup is intended for educational purposes, helping traders understand how smart money operates and how to incorporate institutional-style trading frameworks into their own strategies.


Nifty June 2nd Week Analysis Nifty is looking positive for the upcoming week, and we can expect upside momentum to continue up to 25500 in the upcoming week. Right now, downside risk is looking limited up to 24650, which we can expect only if Nifty daily closes below 24900.

Nifty all set to travel towards ATH & aboveNifty (TF : 1D)
With Positive bias & built, nifty is seems all set to travel towards ATH & above.
- Minor Hurdle at 25200-25325 above this next aim should be 26000 & above 📷
- Interim Support @ 24470 -24360 which need to protect on daily basis from the buyers.

Market Outlook – Nifty Near Critical Levels! Caution Advised
Nifty Weekly Wrap-Up:
The Nifty 50 index closed the week at 25,003, posting a solid gain of +250 points from last week's close. It touched a high of 25,029 and a low of 24,502 during the week.
But here’s the twist—while the uptrend looks strong, we’re now at a crucial inflection point on the weekly chart.
Technical Outlook – Is a Bearish “M” Pattern Forming?
On the weekly timeframe, Nifty is at a level where a bearish M-pattern could potentially develop. To complete this pattern, the index could pull back towards support levels at:
24,414
24,200
24,000
If the selling deepens, the final support zone lies between 23,900–23,700, where a bounce-back is likely.
Bullish Scenario – Can Nifty Break Out?
If Nifty holds above 25,000 for at least 2 consecutive sessions, it could trigger a short-covering rally, paving the way for a move toward key resistance zones at:
25,400
25,565
26,100
Next Week’s Expected Range: 24,500 – 25,500
This range should see most of the action next week. If you're holding long positions, now is a great time to:
✔️ Lock in profits
✔️ Trail stop-losses
✔️ Prepare cash reserves for potential dip-buying opportunities
Global Watch – S&P 500 Hits Key Resistance
The S&P 500 closed near 6,000, up 100 points for the week. But heads up—it’s now testing a strong Fibonacci resistance at 6,013.
A rejection here could lead to a correction toward 5,900–5,850, a dip of 1.5–2.5%. If this unfolds alongside a Nifty pullback, it would align perfectly with our support targets around 24,400–24,500.
Final Takeaway:
Markets are looking stretched. While momentum remains positive, profit booking at higher levels is essential. Don’t get caught unprepared in case of a reversal. Stay tactical, stay liquid.
Smart money is already locking in gains. Are you?


$NIFTY: New highs incoming; 27500 can be cycle highsNSE:NIFTY the index from India which holds the top 50 stocks in India. IN the chart below we have overlayed the SP:SPX index. The NSE:NIFTY and $S&P500 have been in lockstep for more than 5 years as shown in the chart below. The indices are just 2.5% away from their ATH. Even with these levels the RSI for NSE:NIFTY is 61 and 58 in case of $SPX.
The RSI is far from overbought condition. So, this rally which started in NSE:NIFTY can have more legs. With Global liquidity on the rise and RBI easing policy rates the NSE:NIFTY can reach its all-previous highs of the Fib retracement levels. The previous peak was 0.786 Fib retracement level which on this upward sloping chart can be as high as 27500 which can indicate another 10% upside.
Verdict : Stay long $NIFTY. More upside possible. RSI still not overbought.

Nifty Analysis EOD – June 6, 2025 – Friday🟢 Nifty Analysis EOD – June 6, 2025 – Friday 🔴
🎯 25K Now, What's Next?
Nifty opened on a neutral tone, cautiously awaiting the outcome of the RBI Monetary Policy. As the event unfolded and the repo rate cut of 0.5% was announced, the celebration began on Dalal Street—and the charts reflected it.
What followed was a clean, powerful rally, breaking through key levels and carrying the index all the way to the psychological milestone of 25,000, where it closed almost flat on the round number at 25,003.05.
Today’s close is just shy of the May 26th high, and a few hurdles still remain:👉 25,060–25,070👉 25,115–25,130👉 25,180–25,212
These levels will decide whether the breakout from the box range—which we’ve discussed in earlier reviews—truly sustains. As long as there’s no negative trigger over the weekend, bulls may carry the momentum into next week.
🛡 5 Min Chart with Levels
🕯 Daily Time Frame Chart
🕯 Daily Candle Breakdown
Open: 24,748.70
High: 25,029.50
Low: 24,671.45
Close: 25,003.05
Net Change: +252.15 (+1.02%)
📊 Candle Structure Breakdown
Real Body: 254.35 pts (Strong Green)
Upper Wick: 26.45 pts
Lower Wick: 77.25 pts
🔍 Interpretation
A session that began quietly turned into a bullish sprint.
The small upper wick shows there was minimal rejection at higher levels.
The lower wick reflects early dip buying.
The strong green body signals dominant intraday momentum, with bulls in charge from start to finish.
🔦 Candle Type
🟢 Bullish Marubozu–like candle– Almost a full body with small wicks, indicating powerful follow-through buying and confidence among bulls.
📌 Key Insight
25,000 breakout looks clean and technically sound.
Holding above 24,900–24,950 in the coming session could lead to further upside exploration.
All eyes on volume confirmation and whether we can conquer the next resistance band near 25,130+.
🛡 5 Min Intraday Chart
⚔️ Gladiator Strategy Update
ATR: 274.31
IB Range: 91.90 → Medium IB
Market Structure: Balanced
Trades:✅ 10:05 AM – Long Triggered → Target Achieved (1:1.4)✅ 10:40 AM – Long Triggered → Target Achieved (1:2)
📌 Support & Resistance Zones
Resistance Levels
25,062 ~ 25,070
25,116 ~ 25,128
25,180 ~ 25,212
Support Levels
24,972
24,920 ~ 24,894
24,800 ~ 24,768
24,727 ~ 24,737
24,660
💭 Final Thoughts
Momentum is back.Bulls not only broke free from consolidation—they made a statement. The RBI’s surprise move might just be the fuel Nifty needed to launch toward unexplored zones.
📌 “Big breakouts don’t ask for permission. They just happen—when doubt is highest.”
✏️ Disclaimer
This is just my personal viewpoint. Always consult your financial advisor before taking any action.

Nifty to Take support at 21550Nifty is expected to go long from the major support level 0f 21550.
The index might test the levels of 20800 in the worst case.
However the long move beyond 25000 for the index start at 21550 levels.

Nifty 50 at a Turning Point? Key Levels & Market Outlook AheadThe Nifty 50 ended the week at 25,003.30 with a gain of (1.02%)
If Nifty sustains below 24,924, selling pressure may increase. However, a move above 25,283 could restore bullish momentum.
Key Levels for the Upcoming Week
🔹 Price Action Pivot Zone:
The crucial range to watch for potential trend reversals or continuation is 24,924 -25,083.
🔹 Support & Resistance Levels:
Support:
S1: 24,689
S2: 24,375
S3: 23,987
Resistance:
R1: 25,321
R2: 25,639
R3: 26,032
Market Outlook
✅ Bullish Scenario: A sustained breakout above 25,083 could attract buying momentum, driving Nifty towards R1 (25,321) and beyond.
❌ Bearish Scenario: A drop below 24,924 may trigger selling pressure, pushing Nifty towards S1 (24,686) or lower.
Disclaimer: lnkd.in

50 bps Repo Rate Cut boosts Nifty. Can it fly further now?The market was expecting a Repo Rate Cut From RBI. The expectation was for 25bps but what we got today from RBI was a bumper 50 bps rate cut. This propelled Nifty to close above much coveted level of 25K as Nifty managed to close at 25003. Now Nifty has entered a critical resistance zone. This zone starts from around 25037 to 25146. Closing above 25146 is mandatory for Nifty to fly further and gain further momentum. Last 4 weeks or so Nifty has been returning back from this zone. We can see this in the weekly chart of Nifty. With rate cut the chances for Nifty to fly above this most important levels has increased a lot.
The resistances for Nifty Now Remain at: 25037, 25146 (Important Trend line Resistance, Bulls will be very active above this level.), 25473, 25804 and 26277. Further levels will be given once we get a closing above 26277.
The supports for Nifty remain at: 24642, 24425, 23904, 23597 (Most important Mother Line of Weekly Candles). Below this level Nifty will become very week again and bears can drag Nifty further down towards 23201 (Important Trend Line Support). If this is broken in unlikely global or local geo-political event then Nifty can further fall to 22169 or even 21671 levels in unlikely scenario of major geo-political event unfolding.
Disclaimer: The above information is provided for educational purpose, analysis and paper trading only. Please don't treat this as a buy or sell recommendation for the stock or index. The Techno-Funda analysis is based on data that is more than 3 months old. Supports and Resistances are determined by historic past peaks and Valley in the chart. Many other indicators and patterns like EMA, RSI, MACD, Volumes, Fibonacci, parallel channel etc. use historic data which is 3 months or older cyclical points. There is no guarantee they will work in future as markets are highly volatile and swings in prices are also due to macro and micro factors based on actions taken by the company as well as region and global events. Equity investment is subject to risks. I or my clients or family members might have positions in the stocks that we mention in our educational posts. We will not be responsible for any Profit or loss that may occur due to any financial decision taken based on any data provided in this message. Do consult your investment advisor before taking any financial decisions. Stop losses should be an important part of any investment in equity.


Nifty This is the triangle pattern in high time frame analysis im using this pattern and look the volume is great. just study this chart

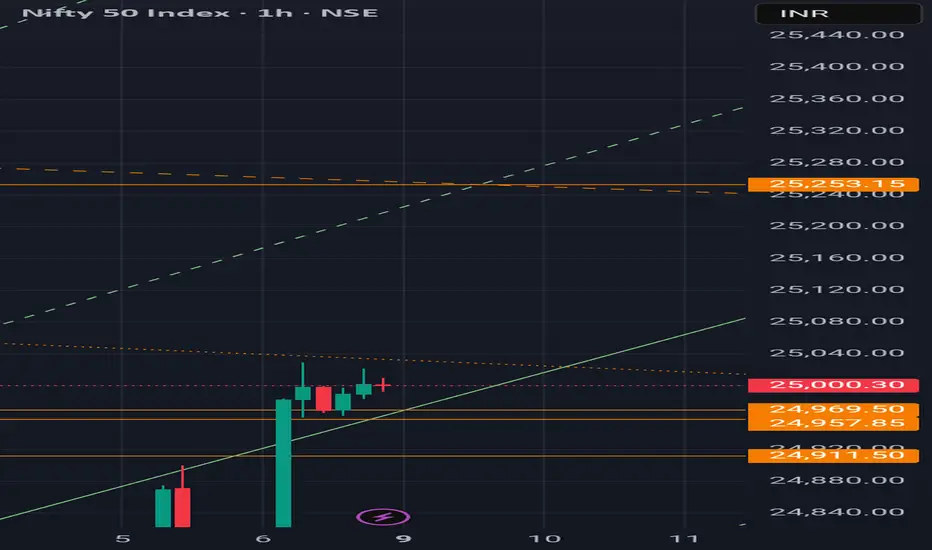
Nifty levels - Jun 09, 2025Nifty support and resistance levels are valuable tools for making informed trading decisions, specifically when combined with the analysis of 5-minute timeframe candlesticks and VWAP. By closely monitoring these levels and observing the price movements within this timeframe, traders can enhance the accuracy of their entry and exit points. It is important to bear in mind that support and resistance levels are not fixed, and they can change over time as market conditions evolve.
The dashed lines on the chart indicate the reaction levels, serving as additional points of significance to consider. Furthermore, take note of the response at the levels of the High, Low, and Close values from the day prior.
We hope you find this information beneficial in your trading endeavors.
* If you found the idea appealing, kindly tap the Boost icon located below the chart. We encourage you to share your thoughts and comments regarding it.
Wishing you success in your trading activities!

NIFTY : 3 Months Time Frame Chart .
NIFTY : 3 Months Time Frame Chart .
BUY was triggered on October 2020 and never looked backed since then .
Important levels to be watched out for are:
25120/26277(ATH)
( Not a Buy / Sell Recommendation
Do your own due diligence ,Market is subject to risks, This is my own view and for learning only .)

Nifty50 Index MovementNSE:NIFTY Index is indicating an Upward Movement. The Rectangular Pattern needs to be broken and move upwards which is what is expected. We could soon expect 26k Range.
More over, if the RBI Moneytary policy today make any rate cut, this will accelerate the Movement.
This is truely for Educational Purpose and if the graph goes as expected we can expect good movement for Nifty 50 stocks Primarily.
#NIFTY Intraday Support and Resistance Levels - 06/06/2025Nifty is opening with a slight gap-up around 24750–24760, placing it just above a key resistance-turned-support level. This setup suggests early optimism, but follow-through momentum is crucial for confirmation.
If Nifty sustains above 24800, it may pave the way for a smooth upside toward 24850, 24900, and 24950+. This range could act as a momentum zone for intraday buyers if volume supports the move.
On the flip side, a slip back below 24700 may signal weakness and open downside targets at 24650, 24600, and 24550, pulling Nifty back into a broader consolidation range.

6 June Nifty breakout & breakdown levels
🔼 CALL (CE) Buy Levels :
24,680 (Opening Support Zone)
CE entry possible if price10m holds above this level.
24,923 (Above Positive Trade View)
Strong bullish sentiment above this zone.
Buy CE if 10-min candle holds above this level.
24518 (Above 10m hold ce by level) bullish momentum
🔽 PUT (PE) Buy Levels:
24,680 (Opening below Resistance Zone)
Below 24,518 (Below 10m Hold PE by Zone)
Below 25,130 (Below 10m PE by Risky Zone)
Risky but possible PE buy if fails to hold
Below 25,330 (Below 10m hold PE by Safe Zone)

Nifty Analysis EOD – June 5, 2025 – Thursday🟢 Nifty Analysis EOD – June 5, 2025 – Thursday 🔴
🎭 Trap and Manipulation on Expiry Day
As discussed in yesterday’s note—a calm before the storm—today delivered the volatility, but not in the form anyone truly expected. Nifty opened with a 53-point gap-up, filled the gap in the first 5 minutes, and then marched upwards to hit a day high of 24,761.
But that wasn't the end…
Within just 20 minutes, Nifty spiked to 24,899—a sharp and unexpected move that defied recent technical context. Why?Because just two sessions ago (June 3), the 24,800 level was a clear rejection zone, yet today the price cut through that zone like butter, crossing the highs of the past 6 sessions—only to fall just as sharply.
📉 That’s not strength—it’s classic expiry day manipulation.
The past 16 sessions have shown candles with unusual shadows, and today added another one to the list. For swing traders, this market structure has been offering no clean entry triggers. The message is loud and clear: focus only on intraday setups and stay cautious.
🛡 5 Min Chart with Levels
🕯 Daily Time Frame Chart
🕯 Daily Candle Breakdown
Open: 24,691.20
High: 24,899.85
Low: 24,613.10
Close: 24,750.90
Net Change: +130.70 (+0.53%)
📊 Candle Structure Breakdown
Real Body: 59.70 pts (Green)
Upper Wick: 148.95 pts
Lower Wick: 78.10 pts
🔍 InterpretationThe candle paints a story of early optimism followed by profit booking or supply absorption near 24,900. Though the day closed green, the long upper shadow shows sellers dominating higher levels, leaving buyers with little to celebrate by the close.
🔦 Candle Type
🟢 Green Spinning Top with Long Upper Wick
Indicates indecision, with a bullish undertone that lacks conviction at higher levels.
📌 Key Insight
24,900 remains a psychological and technical barrier.
A bullish close above 24,900 might invite momentum traders, but until then—suspicion stays.
A breakdown below 24,600 may trigger downside interest again.
🛡 5 Min Intraday Chart
⚔️ Gladiator Strategy Update
ATR: 265.01
IB Range: 148.4 → Medium IB
Market Structure: imBalanced
Trades:✅ 11:00 AM – Long Triggered → Target Achieved (1:1.5)✅ 11:50 AM – Long Triggered → Trailing SL Hit, but Target Achieved (1:4.8)
📌 Support & Resistance Zones
Resistance Levels
24,768 ~ 24,800
24,820
24,882
24,894 (Strong Resistance)
Support Levels
24,727 ~ 24,737
24,660
24,625 ~ 24,640
24,600
24,530 ~ 24,480
24,460
💭 Final Thoughts
A day of deception more than direction.This expiry session was less about trend and more about clearing premiums, trapping both sides, and faking strength in the middle of a boxed consolidation.
📌 “Not every green candle is bullish. Some are just well-disguised traps.”
✏️ Disclaimer
This is just my personal viewpoint. Always consult your financial advisor before taking any action.

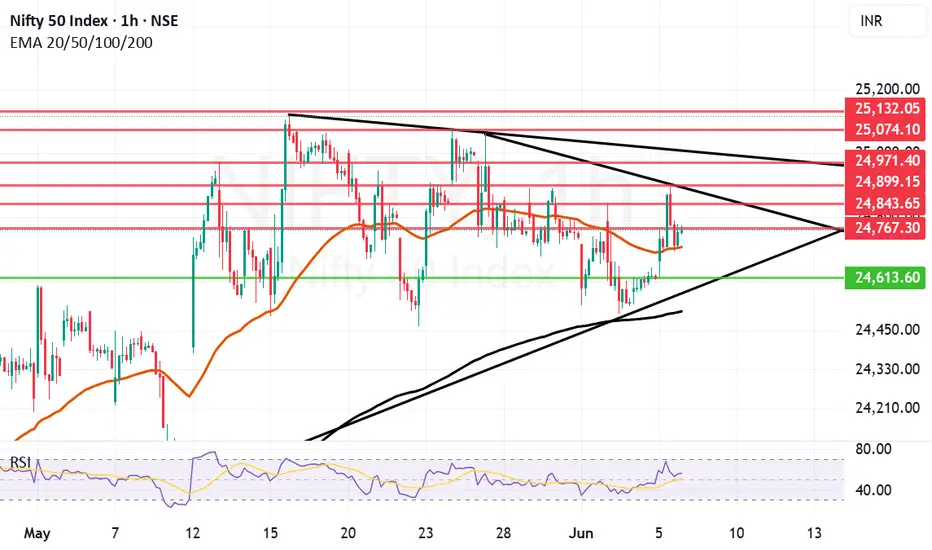
Nifty bounce between Trendline resistance and Mother lineWe Saw a jump of 130 points in Nifty today. The jump could have been higher if trend line resistance would not have come into play. This trend line resistance which came into effect is exactly around 24899 as it can be seen in the chart which was also the day's high. After making this high Nifty fell again until Mother line support present near 24706 again came into act for Nifty to close near 24750.
Thus the supports for Nifty now remain at: 24706 (Mother Line Support), 24613 (Low of today) and Father line Support near 24508. Below 24508 there will be further weakness and Bears will take control of the market.
The Resistances for Nifty now remain at: 24767, 24843, 24899 (trend line resistance), and 24971(Another Trend line resistance). Above 24971 closing Nifty will gain strength again and Bears can pull the market upwards towards 25074 or 25132. Closing above 25132 will be very good for the market as there seems to be a pure Bull territory above this zone.
Disclaimer: The above information is provided for educational purpose, analysis and paper trading only. Please don't treat this as a buy or sell recommendation for the stock or index. The Techno-Funda analysis is based on data that is more than 3 months old. Supports and Resistances are determined by historic past peaks and Valley in the chart. Many other indicators and patterns like EMA, RSI, MACD, Volumes, Fibonacci, parallel channel etc. use historic data which is 3 months or older cyclical points. There is no guarantee they will work in future as markets are highly volatile and swings in prices are also due to macro and micro factors based on actions taken by the company as well as region and global events. Equity investment is subject to risks. I or my clients or family members might have positions in the stocks that we mention in our educational posts. We will not be responsible for any Profit or loss that may occur due to any financial decision taken based on any data provided in this message. Do consult your investment advisor before taking any financial decisions. Stop losses should be an important part of any investment in equity.
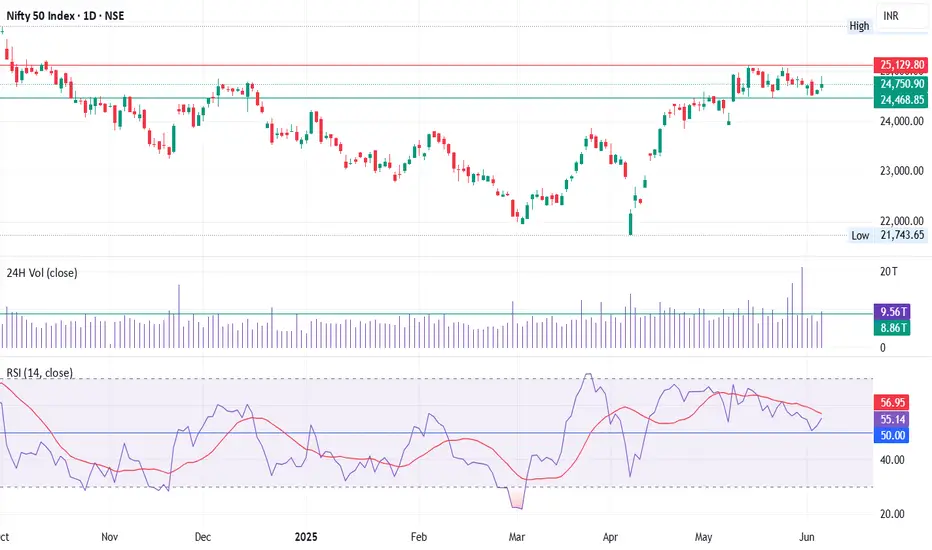
NIFTY 50 Index Daily Chart AnalysisThe Nifty 50 is consolidating in a tight range just below the key psychological resistance at 25,130. The price action has shown multiple attempts to breach this level, indicating selling pressure on rallies. However, strong buying support exists around ₹24,470.
Recent volume is moderate and slightly declining, indicating a lack of conviction on both sides.
Bias: Neutral-to-bullish as long as ₹24,468 holds.
Breakout Potential: Above ₹25,130 with volume may trigger a fresh rally.
Risk: Failure to hold ₹24,468 could result in a drop to ₹24,000.